
 Price Point
Compare Shukra Jewellery with Similar Stocks
ScoreDashboard
With a Operating Losses, the company has a Weak Long Term Fundamental Strength
- Company's ability to service its debt is weak with a poor EBIT to Interest (avg) ratio of 0.48
- The company has been able to generate a Return on Equity (avg) of 0.56% signifying low profitability per unit of shareholders funds
Flat results in Jun 26
Risky - Negative EBITDA
Mojo ParametersStock DNA

Gems, Jewellery And Watches

INR 12 Cr (Micro Cap)

NA (Loss Making)
52

0.00%

-0.06

-0.20%

0.34
Total ReturnsTotal Returns (Price + Dividend) 
Shukra Jewellery for the last several years.
Risk Adjusted Returns v/s
Returns Beta
 News & Corporate Actions
News
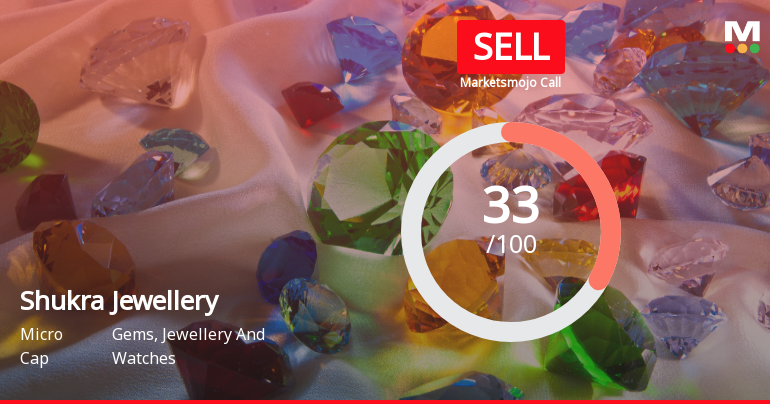
Shukra Jewellery Ltd Upgraded to Sell on Technical Improvements Despite Weak Fundamentals
Shukra Jewellery Ltd, a micro-cap player in the Gems, Jewellery and Watches sector, has seen its investment rating upgraded from Strong Sell to Sell as of 22 September 2026. This change is primarily driven by a mild improvement in technical indicators, despite the company’s ongoing fundamental challenges and flat financial performance in the recent quarter.
Read full news article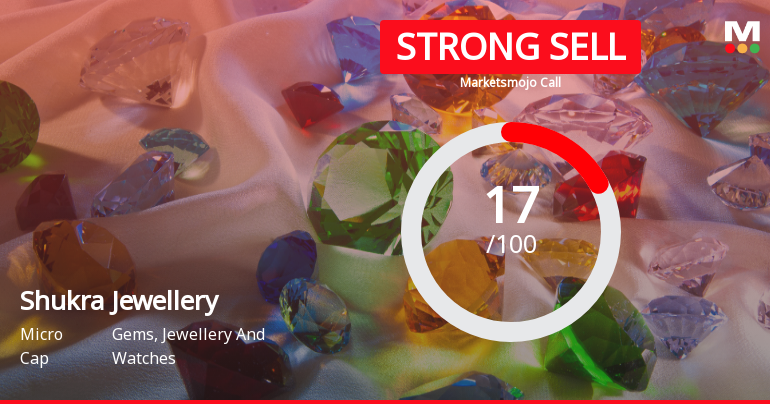
Shukra Jewellery Ltd Downgraded to Strong Sell Amid Weak Fundamentals and Bearish Technicals
Shukra Jewellery Ltd has seen its investment rating downgraded from Sell to Strong Sell as of 31 August 2026, reflecting deteriorating fundamentals and a shift towards bearish technical indicators. The micro-cap company, operating in the Gems, Jewellery and Watches sector, faces mounting challenges across quality, valuation, financial trends, and technical parameters, signalling heightened risk for investors.
Read full news articleAre Shukra Jewellery Ltd latest results good or bad?
Shukra Jewellery Ltd's latest financial results for Q4 FY26 reveal a complex picture characterized by significant operational challenges. The company reported a net loss of ₹0.71 crores, which represents a substantial deterioration compared to the previous year, highlighting ongoing issues with profitability. In contrast, revenue for the quarter reached ₹3.05 crores, reflecting a notable increase of 21.51% year-on-year and a dramatic 593.18% growth quarter-on-quarter. However, this revenue growth masks deeper structural problems, as the operating margin fell to a negative 20.95%, indicating rising cost pressures and operational inefficiencies. The company's performance has been marked by extreme volatility, with revenues fluctuating significantly across recent quarters. This unpredictability raises concerns about the sustainability of its business model. The operating profit before depreciation, interest, ...
Read full news article Announcements
Announcement under Regulation 30 (LODR)-Newspaper Publication
09-Sep-2026 | Source : BSENewspaper advertisement pursuant to regu 30 and 47 of SEBI (LODR) 2015.
Board Meeting Outcome for Out Come Of Board Meeting Pursuant To Regulatin 30 Of SEBI (LODR) Regulations 2015
07-Sep-2026 | Source : BSEPursuant to Regulation 30 of SEBI (LODR) Regulatins 2015 Board has considered the items as per the attachment for the ensuing Annual General Meeting of Membes to be heldo on September 30 2026
Cut Off Date For E Voting At The Ensuing Annual General Meeting
07-Sep-2026 | Source : BSEPursuant to Regulation 42 of SEBI (LODR) Regulations 2015 intimation of cut off date for e-voting at ensuing annual general meeting as per the attachment
Corporate Actions

No Upcoming Board Meetings

No Dividend history available

No Splits history available

No Bonus history available

No Rights history available
Key FactorsQuality key factors
Valuation key factors
Technicals key factors
 Technical Indicator Scale: Bearish, Mildly Bearish, Sideways, Mildly Bullish, Bullish Turned Shareholding
Shareholding Snapshot : Jun 2026
Shareholding Compare (%holding)
Non Institution
None
Held by 8 Schemes (0.19%)
Held by 0 FIIs
Chandrakant Himmatlal Shah (13.95%)
None
44.98%
FinancialQuarterly Results Snapshot (Consolidated) - Jun'26 - QoQ
 Compare with Peers
QoQ Growth in quarter ended Jun 2026 is -74.43% vs 593.18% in Mar 2026

QoQ Growth in quarter ended Jun 2026 is 91.55% vs -7,200.00% in Mar 2026

Half Yearly Results Snapshot (Consolidated) - Sep'25
Growth in half year ended Sep 2025 is -47.11% vs 46.67% in Sep 2024
Growth in half year ended Sep 2025 is 65.79% vs 533.33% in Sep 2024
Nine Monthly Results Snapshot (Consolidated) - Dec'25
YoY Growth in nine months ended Dec 2025 is -33.07% vs 55.76% in Dec 2024
YoY Growth in nine months ended Dec 2025 is 72.97% vs 1,333.33% in Dec 2024
Annual Results Snapshot (Consolidated) - Mar'26
YoY Growth in year ended Mar 2026 is -5.91% vs 6.28% in Mar 2025
YoY Growth in year ended Mar 2026 is -121.43% vs 366.67% in Mar 2025
 Company CV
About Shukra Jewellery Ltd










