
Compare Shyam Metalics with Similar Stocks
Dashboard
Company has a Debt to Equity ratio (avg) of 0.02 times
- NET SALES(Latest six months) At Rs 9,661.82 cr has Grown at 22.37%
- PAT(Latest six months) At Rs 516.33 cr has Grown at 23.98%
- ROCE(HY) Highest at 13.21%
With ROE of 9.3, it has a Very Expensive valuation with a 2.3 Price to Book Value
Majority shareholders : Promoters
Consistent Returns over the last 3 years
Stock DNA
Iron & Steel Products
INR 26,693 Cr (Small Cap)
25.00
26
0.41%
0.04
9.29%
2.34
Total Returns (Price + Dividend) 
Latest dividend: 2.2 per share ex-dividend date: Aug-19-2025
Risk Adjusted Returns v/s
Returns Beta

News
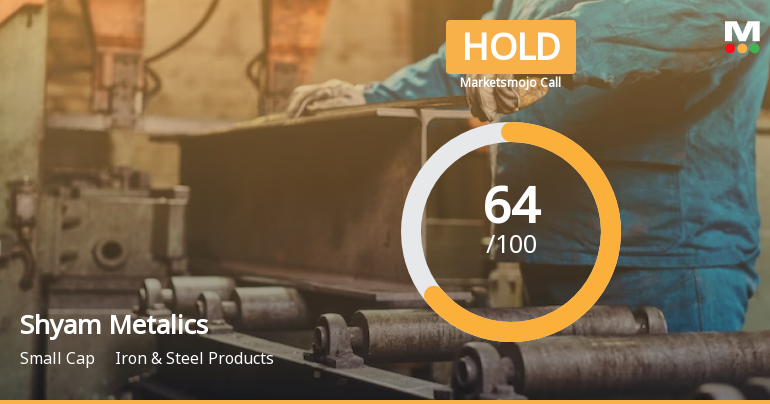
Shyam Metalics & Energy Ltd is Rated Hold
Shyam Metalics & Energy Ltd is rated 'Hold' by MarketsMOJO, with this rating last updated on 15 June 2026. While the rating was revised on that date, the analysis and financial metrics discussed here reflect the company’s current position as of 23 June 2026, providing investors with an up-to-date view of the stock’s fundamentals, returns, and technical outlook.
Read full news article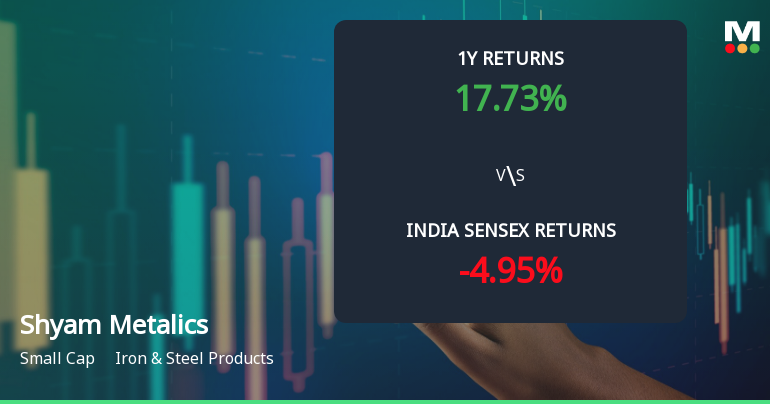
Shyam Metalics & Energy Ltd Technical Momentum Shifts Amid Mixed Indicator Signals
Shyam Metalics & Energy Ltd has experienced a nuanced shift in its technical momentum, transitioning from a bullish to a mildly bullish stance. Despite a 2.21% gain on 19 Jun 2026, the stock’s technical indicators present a complex picture, with mixed signals from MACD, RSI, moving averages, and other momentum oscillators. This analysis delves into the evolving technical landscape and what it means for investors navigating the iron and steel products sector.
Read full news article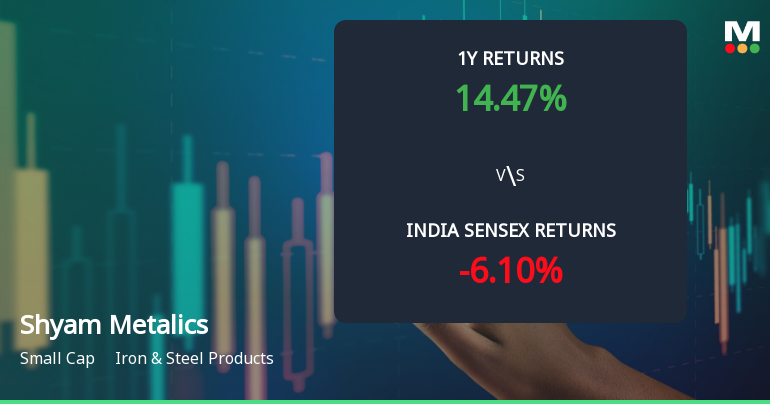
Shyam Metalics & Energy Ltd Technical Momentum Shifts to Bullish Amid Mixed Signals
Shyam Metalics & Energy Ltd has experienced a notable shift in its technical momentum, moving from a mildly bullish stance to a more confident bullish trend. Despite a slight dip in the stock price on 17 Jun 2026, the underlying technical indicators reveal a complex interplay of signals that investors should carefully consider amid the iron and steel sector’s evolving dynamics.
Read full news article Announcements
Announcement under Regulation 30 (LODR)-Analyst / Investor Meet - Intimation
18-Jun-2026 | Source : BSEInvestors Meet with various Institutional Investors / Analysts has been scheduled on 23rd & 24th June 2026 at Singapore
Announcement under Regulation 30 (LODR)-Analyst / Investor Meet - Outcome
18-Jun-2026 | Source : BSEOutcome of the Investors Meet held on Wednesday 17th June 2026
Announcement under Regulation 30 (LODR)-Acquisition
18-Jun-2026 | Source : BSEThe Company has acquired 26% Stake in Emerge Green Power Private Limited resulting it into becoming its Associate Company w.e.f. 18th June 2026.
Corporate Actions

No Upcoming Board Meetings

Shyam Metalics & Energy Ltd has declared 22% dividend, ex-date: 19 Aug 25

No Splits history available

No Bonus history available

No Rights history available
Quality key factors
Valuation key factors
Technicals key factors
 Technical Indicator Scale: Bearish, Mildly Bearish, Sideways, Mildly Bullish, Bullish Turned
 Shareholding Snapshot : Mar 2026
Shareholding Compare (%holding)
Promoters
None
Held by 20 Schemes (1.63%)
Held by 81 FIIs (3.09%)
Subham Buildwell Pvt. Ltd. (21.86%)
Life Insurance Corporation Of India (5.47%)
4.76%
Quarterly Results Snapshot (Consolidated) - Mar'26 - QoQ

QoQ Growth in quarter ended Mar 2026 is 18.52% vs -1.03% in Dec 2025
QoQ Growth in quarter ended Mar 2026 is 61.78% vs -24.65% in Dec 2025
Half Yearly Results Snapshot (Consolidated) - Sep'25
Growth in half year ended Sep 2025 is 22.50% vs 15.49% in Sep 2024
Growth in half year ended Sep 2025 is 12.67% vs -28.56% in Sep 2024
Nine Monthly Results Snapshot (Consolidated) - Dec'25
YoY Growth in nine months ended Dec 2025 is 20.86% vs 14.73% in Dec 2024
YoY Growth in nine months ended Dec 2025 is 8.96% vs -15.47% in Dec 2024
Annual Results Snapshot (Consolidated) - Mar'26
YoY Growth in year ended Mar 2026 is 22.39% vs 14.88% in Mar 2025
YoY Growth in year ended Mar 2026 is 17.85% vs -12.24% in Mar 2025
About Shyam Metalics & Energy Ltd

Company Coordinates


