
Compare Sical Logistics with Similar Stocks
Dashboard
High Debt company with Weak Long Term Fundamental Strength
- Poor long term growth as Net Sales has grown by an annual rate of -5.20% over the last 5 years
- High Debt Company with a Debt to Equity ratio (avg) of 8.05 times
- The company has reported losses. Due to this company has reported negative ROE
Flat results in Mar 26
56.75% of Promoter Shares are Pledged
Stock DNA
Transport Services
INR 633 Cr (Micro Cap)
NA (Loss Making)
34
0.00%
3.19
-6.75%
4.68
Total Returns (Price + Dividend) 
Sical Logistics for the last several years.
Risk Adjusted Returns v/s
Returns Beta

News

Sical Logistics Ltd Locks at Upper Circuit With 5% Gain — Buyers Queue, Sellers Absent
At Rs 83.49, the buying was done — not because demand dried up, but because the exchange wouldn't let the stock go any higher. Sical Logistics Ltd locked at its upper circuit of 5% on 12 Jun 2026, with buyers queuing and no sellers willing to part with shares.
Read full news article
Sical Logistics Ltd Upgraded to Sell on Technical and Valuation Improvements
Sical Logistics Ltd, a micro-cap player in the transport services sector, has seen its investment rating upgraded from Strong Sell to Sell as of 10 June 2026. This change reflects a nuanced improvement across technical indicators and valuation metrics, despite ongoing challenges in financial performance and long-term fundamentals. The company’s stock price has shown resilience recently, supported by a shift in technical trends and a more attractive valuation relative to peers.
Read full news article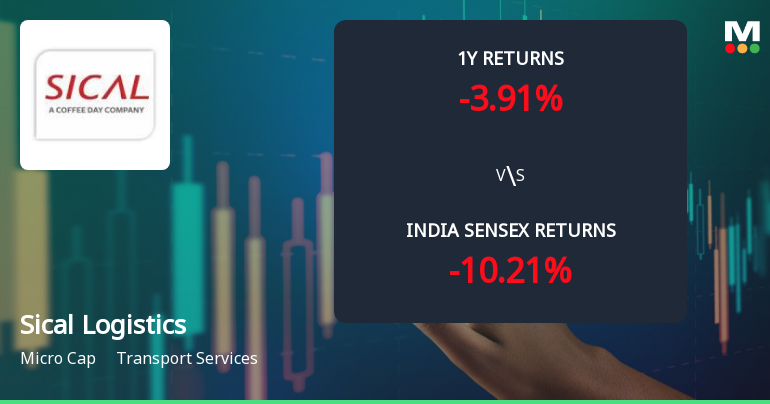
Sical Logistics Ltd Technical Momentum Shifts Amid Mixed Market Signals
Sical Logistics Ltd has exhibited a notable shift in its technical momentum, moving from a mildly bearish stance to a sideways trend, reflecting a complex interplay of bullish and bearish signals across key technical indicators. Despite a 1.8% gain on 11 Jun 2026, the transport services micro-cap remains under pressure with a MarketsMOJO Mojo Score of 34.0 and a Sell grade, albeit improved from a Strong Sell rating just a day prior.
Read full news article Announcements
Announcement under Regulation 30 (LODR)-Newspaper Publication
02-Jun-2026 | Source : BSESical Logistics Limited has informed the exchange about the newspaper clippings containing the publication of the audited financial results for the quarter and financial year ended March 31 2026.
Audited Financial Results For The Quarter And Financial Year Ended March 31 2026
29-May-2026 | Source : BSESical Logistics Limited has submitted the audited standalone and consolidated financial results for the quarter and financial year ended March 31 2026.
Board Meeting Outcome for Outcome Of The Meeting Of The Board Of Directors Of The Company Held On May 29 2026
29-May-2026 | Source : BSESical Logistics Limited (Company) has informed the exchange that the board of directors of the Company at its meeting held on May 29 2026 has considered and approved the audited standalone and consolidated financial results for the quarter and financial year ended on March 31 2026
Corporate Actions

No Upcoming Board Meetings

No Dividend history available

No Splits history available

No Bonus history available

Sical Logistics Ltd has announced 11:5 rights issue, ex-date: 18 Feb 26
Quality key factors
Valuation key factors
Technicals key factors
 Technical Indicator Scale: Bearish, Mildly Bearish, Sideways, Mildly Bullish, Bullish Turned
 Shareholding Snapshot : Mar 2026
Shareholding Compare (%holding)
Promoters
56.7462
Held by 5 Schemes (0.0%)
Held by 6 FIIs (3.09%)
Pristine Malwa Logistics Park Private Limited (73.5%)
Shaunak Jagdish Shah (4.72%)
14.81%
Quarterly Results Snapshot (Consolidated) - Mar'26 - QoQ

QoQ Growth in quarter ended Mar 2026 is 12.89% vs 3.73% in Dec 2025

QoQ Growth in quarter ended Mar 2026 is -120.71% vs 310.25% in Dec 2025
Half Yearly Results Snapshot (Consolidated) - Sep'25
Growth in half year ended Sep 2025 is 106.11% vs -30.87% in Sep 2024
Growth in half year ended Sep 2025 is 129.73% vs -11.12% in Sep 2024
Nine Monthly Results Snapshot (Consolidated) - Dec'25
YoY Growth in nine months ended Dec 2025 is 99.35% vs -20.44% in Dec 2024
YoY Growth in nine months ended Dec 2025 is 289.23% vs -162.10% in Dec 2024
Annual Results Snapshot (Consolidated) - Mar'26
YoY Growth in year ended Mar 2026 is 73.87% vs 0.33% in Mar 2025
YoY Growth in year ended Mar 2026 is 235.56% vs -34.93% in Mar 2025
About Sical Logistics Ltd

Company Coordinates


