
Compare Siemens with Similar Stocks
Dashboard
The company is Net-Debt Free
Poor long term growth as Net Sales has grown by an annual rate of 9.40% over the last 5 years
Negative results in Mar 26
With ROE of 11.5, it has a Very Expensive valuation with a 9.4 Price to Book Value
Majority shareholders : Promoters
Market Beating Performance
Stock DNA
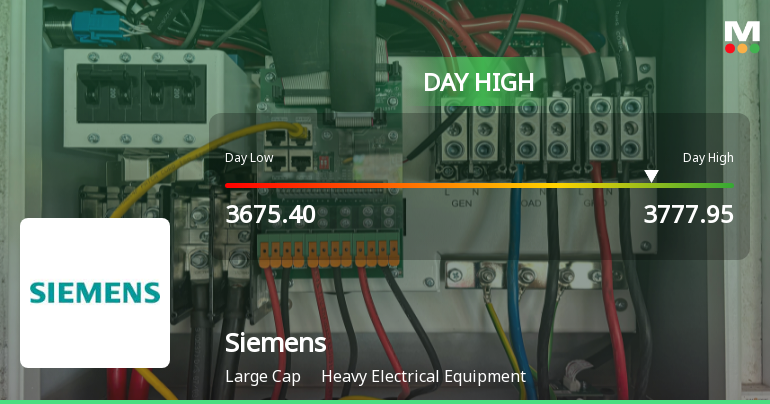
Heavy Electrical Equipment
INR 135,126 Cr (Large Cap)
82.00
NA
0.49%
-0.38
11.49%
9.43
Total Returns (Price + Dividend) 
Latest dividend: 18.00345205479452 per share ex-dividend date: Jul-29-2026
Risk Adjusted Returns v/s
Returns Beta

News
Siemens Ltd. Rallies 3.07% and Holds Above All Major Moving Averages — Momentum Gains Traction
The Sensex edged up a modest 0.06% on 31 Jul 2026, while Siemens Ltd. surged 3.07%, outperforming its sector by 1.33 percentage points. This strong single-session gain stands out as a clear stock-specific event amid a broadly steady market, signalling renewed momentum for the heavy electrical equipment giant.
Read full news article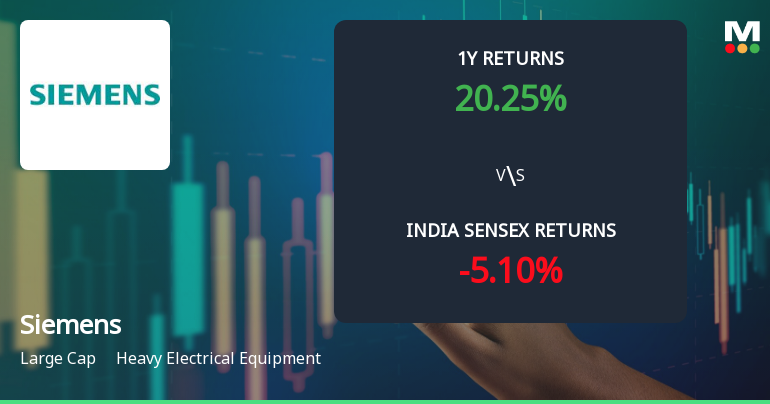
Siemens Ltd. Technical Momentum Shifts Signal Bullish Outlook Amid Market Volatility
Siemens Ltd., a heavyweight in the Heavy Electrical Equipment sector, has witnessed a notable shift in its technical momentum, moving from a mildly bullish stance to a more confident bullish trend. This transition is underscored by a complex interplay of technical indicators including MACD, RSI, moving averages, and volume-based metrics, signalling a potential uptrend despite recent price fluctuations and a day-on-day decline of 1.10%.
Read full news article
Siemens Ltd. is Rated Hold by MarketsMOJO
Siemens Ltd. is rated 'Hold' by MarketsMOJO, a rating that was last updated on 08 April 2026. While this rating change occurred several months ago, the analysis and financial metrics presented here reflect the stock's current position as of 28 July 2026, providing investors with an up-to-date perspective on the company’s performance and outlook.
Read full news article Announcements
Siemens Limited - Analysts/Institutional Investor Meet/Con. Call Updates
21-Nov-2019 | Source : NSESiemens Limited has informed the Exchange regarding Analysts/Institutional Investor Meet/Con. Call Updates
Siemens Limited - Updates
13-Nov-2019 | Source : NSESiemens Limited has informed the Exchange regarding 'We refer to our letter dated 12th November, 2019 informing about the Company s next Board Meeting date.
Updates
01-Sep-2019 | Source : NSE
| Siemens Limited has informed the Exchange regarding 'Please find attached the list of Key Managerial Personnel of the Company as per Regulation 30(5) of the SEBI (Listing Obligations and Disclosure Requirements) Regulations, 2015, with effect from 1st September, 2019.'. |
Corporate Actions

No Upcoming Board Meetings

Siemens Ltd. has declared 900% dividend, ex-date: 29 Jul 26

Siemens Ltd. has announced 2:10 stock split, ex-date: 13 Jun 06

Siemens Ltd. has announced 1:1 bonus issue, ex-date: 29 Feb 08

No Rights history available
Quality key factors
Valuation key factors
Technicals key factors
 Technical Indicator Scale: Bearish, Mildly Bearish, Sideways, Mildly Bullish, Bullish Turned
 Shareholding Snapshot : Jun 2026
Shareholding Compare (%holding)
Promoters
None
Held by 36 Schemes (3.92%)
Held by 571 FIIs (6.47%)
Siemens International Holding B.v. (53.7%)
Life Insurance Corporation Of India (2.36%)
7.39%
Quarterly Results Snapshot (Consolidated) - Mar'26 - YoY

YoY Growth in quarter ended Mar 2026 is 14.60% vs -2.97% in Mar 2025

YoY Growth in quarter ended Mar 2026 is -36.41% vs -27.49% in Mar 2025
Half Yearly Results Snapshot (Standalone) - Mar'26
Growth in half year ended Mar 2026 is 215.40% vs -0.76% in Mar 2025
Growth in half year ended Mar 2026 is 105.79% vs -9.02% in Mar 2025
Nine Monthly Results Snapshot (Consolidated) - Jun'25
YoY Growth in nine months ended Jun 2025 is 4.89% vs -15.43% in Jun 2024
YoY Growth in nine months ended Jun 2025 is -14.13% vs 35.69% in Jun 2024
Annual Results Snapshot (Consolidated) - Mar'26
Not Applicable: The company has declared_date for only one period
Not Applicable: The company has declared_date for only one period
About Siemens Ltd.

Company Coordinates


