
Compare Sigma Advanced S with Similar Stocks
Stock DNA
Aerospace & Defense
INR 10,074 Cr (Micro Cap)
36.00
43
0.00%
0.66
59.43%
20.27
Total Returns (Price + Dividend) 
Latest dividend: 1.2 per share ex-dividend date: Jun-10-2008
Risk Adjusted Returns v/s
Returns Beta

News
Sigma Advanced System Ltd is Rated Buy
Sigma Advanced System Ltd is rated Buy by MarketsMOJO. This rating was last updated on 26 May 2026, reflecting a shift from a previous Hold stance. However, the analysis and financial metrics presented here are based on the stock's current position as of 11 July 2026, providing investors with the most recent and relevant data to assess the company’s prospects.
Read full news article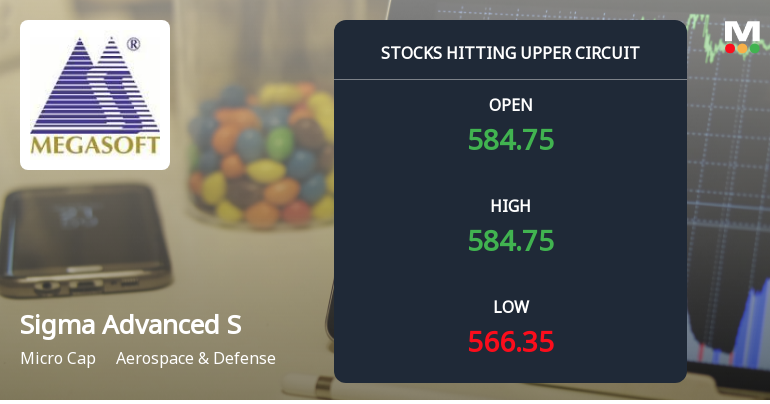
Sigma Advanced System Ltd Locks at Upper Circuit With 5% Gain — Buyers Queue, Sellers Absent
At Rs 585.95, the buying was done — not because demand dried up, but because the exchange wouldn't let the stock go any higher. Sigma Advanced System Ltd locked at its upper circuit of 5% on 10 Jul 2026, with buyers queuing and no sellers willing to part with shares.
Read full news article
Sigma Advanced System Ltd Locks at Upper Circuit With 5.0% Gain — Buyers Queue, Sellers Absent
At Rs 558.05, the buying was done — not because demand dried up, but because the exchange wouldn't let the stock go any higher. Sigma Advanced System Ltd locked at its upper circuit of 5.0% on 08 Jul 2026, with buyers queuing and no sellers willing to part with shares.
Read full news article Announcements
Megasoft Limited - Outcome of Board Meeting
18-Nov-2019 | Source : NSEOutcome of Board Meeting In furtherance to our intimation to the Exchanges dated 01.10.2019,the Board of Directors of the Company considered the request dated 27.09.2019 for re-classification from 'Promoter & Promoter Group Category to Public Category received from S. Ravindra Babu, S. Ravindra Babu (HUF) and S. Rajagopal Reddy in respect of 32,03,956 (Thirty Two Lakh Three Thousand Nine Hundred and Fifty Six) equity shares held by them in the Company in compliance with Regulation 31A of SEBI (Listing Obligations and Disclosure Requirements) Regulations, 2015 ('the Listing Regulations').
Megasoft Limited - Outcome of Board Meeting
15-Nov-2019 | Source : NSEMegasoft Limited has informed the Exchange regarding Board meeting held on November 14, 2019 for approving of Standalone and Consolidated Unaudited Financial Results Of The Company For Quarter and Half Year Ended 30.09.2019
Megasoft Limited - Resignation
29-Oct-2019 | Source : NSEMegasoft Limited has informed the Exchange regarding Resignation of Mr DUVVUR SUDHAKAR REDDY as Executive Director of the company w.e.f. October 27, 2019.
Corporate Actions

No Upcoming Board Meetings

Sigma Advanced System Ltd has declared 12% dividend, ex-date: 10 Jun 08

No Splits history available

No Bonus history available

Sigma Advanced System Ltd has announced 2:3 rights issue, ex-date: 12 Jul 21
Quality key factors
Valuation key factors
Technicals key factors
 Technical Indicator Scale: Bearish, Mildly Bearish, Sideways, Mildly Bullish, Bullish Turned
 Shareholding Snapshot : Mar 2026
Shareholding Compare (%holding)
Promoters
None
Held by 0 Schemes
Held by 9 FIIs (0.07%)
Chintalapati Holdings Private Limited (46.31%)
None
23.8%
Quarterly Results Snapshot (Consolidated) - Mar'26 - QoQ

QoQ Growth in quarter ended Mar 2026 is 121.56% vs 702.75% in Dec 2025

QoQ Growth in quarter ended Mar 2026 is 12,570.87% vs -124.35% in Dec 2025
Half Yearly Results Snapshot (Consolidated) - Sep'25
Growth in half year ended Sep 2025 is 0.00% vs 0.00% in Sep 2024
Growth in half year ended Sep 2025 is 540.69% vs -16,436.84% in Sep 2024
Nine Monthly Results Snapshot (Consolidated) - Dec'25
YoY Growth in nine months ended Dec 2025 is 667.25% vs 0.00% in Dec 2024
YoY Growth in nine months ended Dec 2025 is 672.10% vs -414.75% in Dec 2024
Annual Results Snapshot (Consolidated) - Mar'26
YoY Growth in year ended Mar 2026 is 358.16% vs 0.00% in Mar 2025
YoY Growth in year ended Mar 2026 is 2,017.31% vs -9.65% in Mar 2025
About Sigma Advanced System Ltd

Company Coordinates


