
Compare Signpost India with Similar Stocks
Stock DNA
Media & Entertainment
INR 1,591 Cr (Micro Cap)
24.00
NA
0.16%
0.62
24.37%
5.85
Total Returns (Price + Dividend) 
Latest dividend: 0.494190079778009 per share ex-dividend date: Sep-19-2025
Risk Adjusted Returns v/s
Returns Beta

News

Signpost India Ltd is Rated Hold
Signpost India Ltd is rated 'Hold' by MarketsMOJO, with this rating last updated on 15 June 2026. While the rating change occurred on that date, the analysis and financial metrics discussed here reflect the stock's current position as of 02 July 2026, providing investors with the most up-to-date view of the company’s fundamentals and market performance.
Read full news article
Signpost India Ltd Technical Momentum Shifts Signal Bullish Outlook Amid Market Volatility
Signpost India Ltd has exhibited a notable shift in technical momentum, moving from a mildly bullish stance to a more confident bullish trend. This transition is underscored by a strong daily moving average alignment, bullish Bollinger Bands on the weekly chart, and improving volume indicators, signalling renewed investor interest amid a 10.65% surge in the stock price.
Read full news article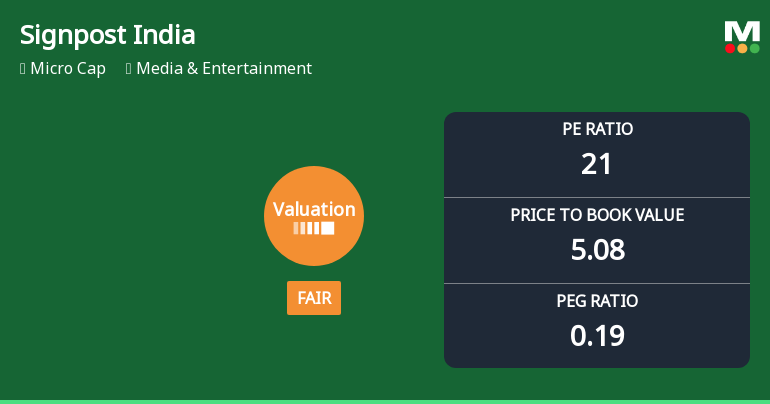
Signpost India Ltd Valuation Shifts to Fair Amid Strong Market Performance
Signpost India Ltd, a micro-cap player in the Media & Entertainment sector, has witnessed a notable shift in its valuation parameters, moving from an attractive to a fair rating. This change reflects evolving market perceptions amid a backdrop of strong operational metrics and mixed peer comparisons, prompting investors to reassess the stock’s price attractiveness relative to its historical and sector benchmarks.
Read full news article Announcements
Corporate Actions

No Upcoming Board Meetings

Signpost India Ltd has declared 25% dividend, ex-date: 19 Sep 25

No Splits history available

No Bonus history available

No Rights history available
Quality key factors
Valuation key factors
Technicals key factors
 Technical Indicator Scale: Bearish, Mildly Bearish, Sideways, Mildly Bullish, Bullish Turned
 Shareholding Snapshot : Mar 2026
Shareholding Compare (%holding)
Promoters
None
Held by 0 Schemes
Held by 5 FIIs (0.09%)
Shripad Pralhad Ashtekar (29.41%)
Navin Chand Suchanti (7.14%)
30.82%
Quarterly Results Snapshot (Consolidated) - Mar'26 - QoQ

QoQ Growth in quarter ended Mar 2026 is 13.76% vs 6.21% in Dec 2025
QoQ Growth in quarter ended Mar 2026 is 16.11% vs 15.77% in Dec 2025
Half Yearly Results Snapshot (Consolidated) - Sep'25

Growth in half year ended Sep 2025 is 18.03% vs 28.33% in Sep 2024
Growth in half year ended Sep 2025 is 14.00% vs 61.16% in Sep 2024
Nine Monthly Results Snapshot (Consolidated) - Dec'25
YoY Growth in nine months ended Dec 2025 is 20.92% vs 20.55% in Dec 2024
YoY Growth in nine months ended Dec 2025 is 49.19% vs 25.01% in Dec 2024
Annual Results Snapshot (Consolidated) - Mar'26
YoY Growth in year ended Mar 2026 is 27.08% vs 16.98% in Mar 2025
YoY Growth in year ended Mar 2026 is 107.24% vs -23.31% in Mar 2025
About Signpost India Ltd

Company Coordinates


