
Compare Sikko Industries with Similar Stocks
Dashboard
Poor long term growth as Net Sales has grown by an annual rate of 6.24% and Operating profit at 18.10% over the last 5 years
- PBT LESS OI(Q) At Rs -4.03 cr has Fallen at -158.33%
- PAT(Q) At Rs -2.01 cr has Fallen at -128.4%
- ROCE(HY) Lowest at 7.27%
Below par performance in long term as well as near term
Total Returns (Price + Dividend) 
Latest dividend: 0 per share ex-dividend date: Dec-28-2022
Risk Adjusted Returns v/s
Returns Beta

News
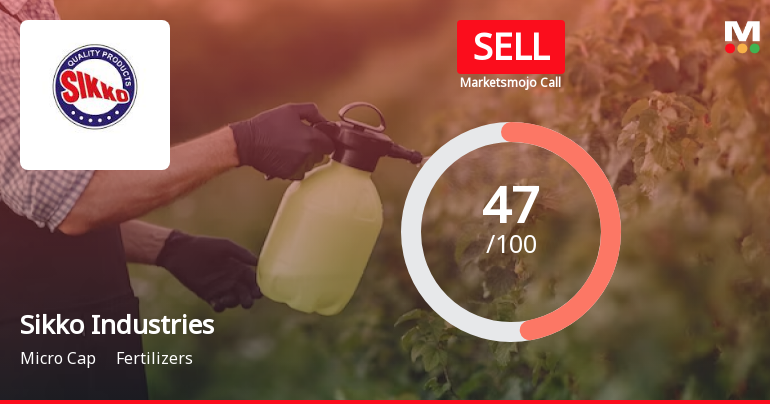
Sikko Industries Ltd is Rated Sell
Sikko Industries Ltd is rated Sell by MarketsMOJO, with this rating last updated on 24 May 2026. While the rating change occurred on that date, the analysis and financial metrics discussed here reflect the stock's current position as of 31 May 2026, providing investors with the latest insights into the company's performance and outlook.
Read full news article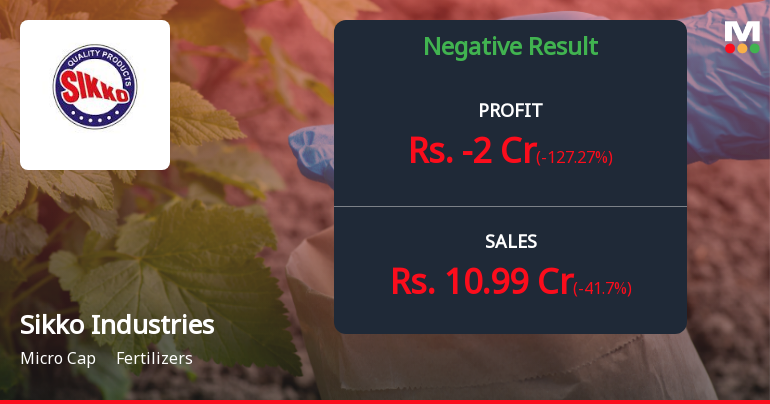
Sikko Industries Q4 FY26: Sharp Quarterly Loss Raises Concerns Despite Strong Annual Growth
Sikko Industries Ltd., an Ahmedabad-based fertiliser company, reported a concerning quarterly loss of ₹2.01 crores for Q4 FY26 (Mar'26), marking a sharp reversal from the ₹2.08 crores profit posted in the previous quarter. The 196.63% sequential decline and 128.41% year-on-year deterioration have raised red flags amongst investors, even as the company's stock has delivered extraordinary returns over longer timeframes. With a market capitalisation of ₹188.26 crores and current trading price of ₹4.31, the micro-cap fertiliser manufacturer faces mounting scrutiny over operational sustainability and profitability consistency.
Read full news article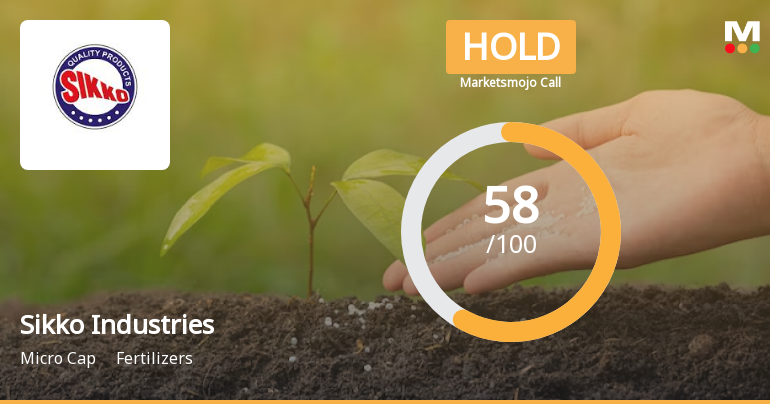
Sikko Industries Ltd is Rated Hold
Sikko Industries Ltd is rated 'Hold' by MarketsMOJO, with this rating last updated on 03 Nov 2025. However, the analysis and financial metrics discussed here reflect the stock's current position as of 19 May 2026, providing investors with an up-to-date perspective on the company’s performance and outlook.
Read full news article Announcements
Sikko Industries Limited - Outcome of Board Meeting
15-Nov-2019 | Source : NSESikko Industries Limited has informed the Exchange regarding Board meeting held on November 14, 2019.
Sikko Industries Limited - Updates
18-Oct-2019 | Source : NSESikko Industries Limited has informed the Exchange regarding 'Intimation of Contact of personnel pursuant to Regulation 30(5) of the SEBI (Listing Obligations and Disclosure Requirements) Regulations, 2015.'.
Sikko Industries Limited - Updates
16-Oct-2019 | Source : NSESikko Industries Limited has informed the Exchange regarding 'Certificate under Regulation 74(5) of the SEBI (Depositories and Participants) Regulations, 2018 for the quarter ended September 30, 2019'.
Corporate Actions

No Upcoming Board Meetings

Sikko Industries Ltd has declared 1% dividend, ex-date: 28 Dec 22

Sikko Industries Ltd has announced 1:10 stock split, ex-date: 27 Nov 25

Sikko Industries Ltd has announced 1:1 bonus issue, ex-date: 08 Dec 25

Sikko Industries Ltd has announced 3:10 rights issue, ex-date: 06 Dec 24
Quality key factors
Valuation key factors
Technicals key factors
 Technical Indicator Scale: Bearish, Mildly Bearish, Sideways, Mildly Bullish, Bullish Turned
 Shareholding Snapshot : Mar 2026
Shareholding Compare (%holding)
Promoters
None
Held by 0 Schemes
Held by 7 FIIs (8.01%)
Jayantibhai Mohanbhai Kumbhani (25.52%)
Zeta Global Funds (oeic) Pcc Limited-zeta Series B Fund Pc (4.35%)
33.45%
Quarterly Results Snapshot (Standalone) - Mar'26 - YoY

YoY Growth in quarter ended Mar 2026 is -41.70% vs 32.10% in Mar 2025

YoY Growth in quarter ended Mar 2026 is -127.27% vs -235.38% in Mar 2025
Half Yearly Results Snapshot (Standalone) - Sep'25
Growth in half year ended Sep 2025 is 19.59% vs -6.73% in Sep 2024
Growth in half year ended Sep 2025 is 30.65% vs 83.33% in Sep 2024
Nine Monthly Results Snapshot (Standalone) - Dec'25
YoY Growth in nine months ended Dec 2025 is 25.95% vs -8.78% in Dec 2024
YoY Growth in nine months ended Dec 2025 is 37.86% vs 51.03% in Dec 2024
Annual Results Snapshot (Standalone) - Mar'26
YoY Growth in year ended Mar 2026 is 5.28% vs 0.75% in Mar 2025
YoY Growth in year ended Mar 2026 is 19.67% vs 5.17% in Mar 2025
About Sikko Industries Ltd

Company Coordinates


