
Compare Silver Touch with Similar Stocks
Dashboard
Company has a Debt to Equity ratio (avg) of 0.07 times
Healthy long term growth as Operating profit has grown by an annual rate 54.51%
With a growth in Net Profit of 43.54%, the company declared Very Positive results in Mar 26
Market Beating performance in long term as well as near term
Stock DNA
Computers - Software & Consulting
INR 2,560 Cr (Micro Cap)
71.00
20
0.03%
0.12
21.06%
14.88
Total Returns (Price + Dividend) 
Latest dividend: 0.5 per share ex-dividend date: Aug-19-2025
Risk Adjusted Returns v/s
Returns Beta

News
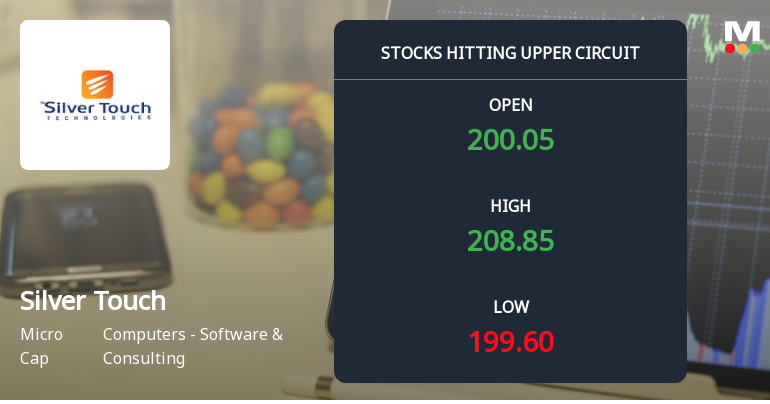
Silver Touch Technologies Ltd Locks at Upper Circuit With 5% Gain — Buyers Queue, Sellers Absent
At Rs 208.71, the buying was done — not because demand dried up, but because the exchange wouldn't let the stock go any higher. Silver Touch Technologies Ltd locked at its upper circuit of 5.0% on 15 Jun 2026, with buyers queuing and no sellers willing to part with shares.
Read full news article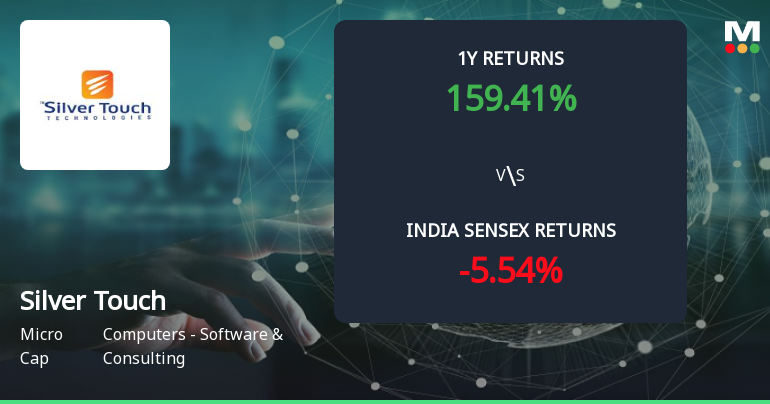
154.92% Stock Return, 61% Profit Growth: What's Driving Silver Touch Technologies Ltd's Multibagger Rerating?
A 154.92% stock return in one year. A 61% growth in net profit over the same period. The gap between those two numbers — roughly 94 percentage points — is driven largely by the market's willingness to pay a significantly higher multiple for each rupee of Silver Touch Technologies Ltd's earnings. That premium valuation is the central story behind this multibagger rally.
Read full news article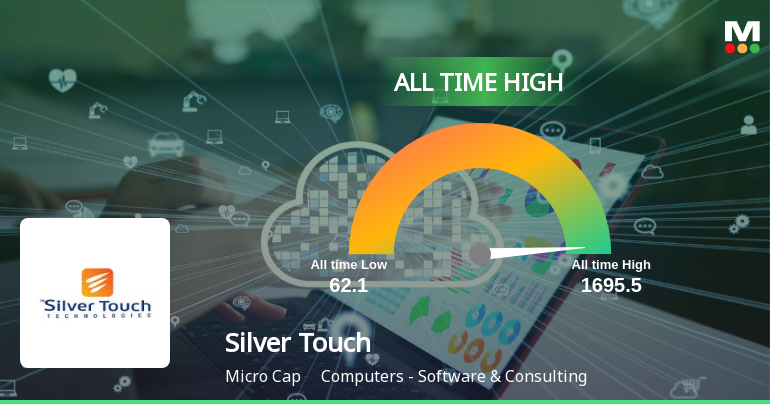
Silver Touch Technologies Ltd Hits All-Time High of Rs 208.45 as Momentum Builds Across Timeframes
Extending its winning streak to three consecutive sessions, Silver Touch Technologies Ltd surged to a fresh all-time high of Rs 208.45 on 15 Jun 2026, marking a 4.78% intraday gain and outperforming its sector by 1.59%.
Read full news article Announcements
Compliances-Reg.24(A)-Annual Secretarial Compliance
30-May-2026 | Source : BSEEnclosed herewith the Annual Secretarial Compliance Report for the FY ended as on 31st March 2026
Announcement under Regulation 30 (LODR)-Newspaper Publication
02-May-2026 | Source : BSEEnclosed herewith copy of Newspaper Publication of Financial Result for the Fourth Quarter and Year Ended 31st March 2026.
Appointment of Company Secretary and Compliance Officer
30-Apr-2026 | Source : BSEEnclosed herewith the Intimation for Appointment of Company Secretary and Compliance Officer of the Company w.e.f. 1st May 2026
Corporate Actions

No Upcoming Board Meetings

Silver Touch Technologies Ltd has declared 5% dividend, ex-date: 19 Aug 25

Silver Touch Technologies Ltd has announced 2:10 stock split, ex-date: 06 Mar 26

Silver Touch Technologies Ltd has announced 1:1 bonus issue, ex-date: 06 Mar 26

No Rights history available
Quality key factors
Valuation key factors
Technicals key factors
 Technical Indicator Scale: Bearish, Mildly Bearish, Sideways, Mildly Bullish, Bullish Turned
 Shareholding Snapshot : Mar 2026
Shareholding Compare (%holding)
Promoters
4.0775
Held by 0 Schemes
Held by 5 FIIs (0.66%)
Vipul Haridas Thakkar (21.13%)
Gagandeep Credit Capital Pvt Ltd (6.7%)
12.69%
Quarterly Results Snapshot (Consolidated) - Mar'26 - YoY

YoY Growth in quarter ended Mar 2026 is 17.35% vs 8.72% in Mar 2025

YoY Growth in quarter ended Mar 2026 is 43.54% vs 45.73% in Mar 2025
Half Yearly Results Snapshot (Consolidated) - Sep'25
Growth in half year ended Sep 2025 is 12.97% vs 38.36% in Sep 2024
Growth in half year ended Sep 2025 is 48.96% vs 51.97% in Sep 2024
Nine Monthly Results Snapshot (Consolidated) - Dec'25
YoY Growth in nine months ended Dec 2025 is 18.95% vs 38.76% in Dec 2024
YoY Growth in nine months ended Dec 2025 is 73.42% vs 33.13% in Dec 2024
Annual Results Snapshot (Consolidated) - Mar'26
YoY Growth in year ended Mar 2026 is 18.47% vs 28.35% in Mar 2025
YoY Growth in year ended Mar 2026 is 60.95% vs 38.23% in Mar 2025
About Silver Touch Technologies Ltd

Company Coordinates


