
Compare Simm. Marshall with Similar Stocks
Dashboard
Weak Long Term Fundamental Strength with an average Return on Capital Employed (ROCE) of 9.33%
- Poor long term growth as Net Sales has grown by an annual rate of 12.16% over the last 5 years
- Low ability to service debt as the company has a high Debt to EBITDA ratio of 2.17 times
With a growth in Operating Profit of 16.87%, the company declared Very Positive results in Mar 26
With ROCE of 19, it has a Attractive valuation with a 2.3 Enterprise value to Capital Employed
Majority shareholders : Promoters
Consistent Returns over the last 3 years
Stock DNA
Auto Components & Equipments
INR 231 Cr (Micro Cap)
15.00
33
0.00%
1.15
25.37%
3.76
Total Returns (Price + Dividend) 
Latest dividend: 0.5 per share ex-dividend date: Sep-05-2019
Risk Adjusted Returns v/s
Returns Beta

News
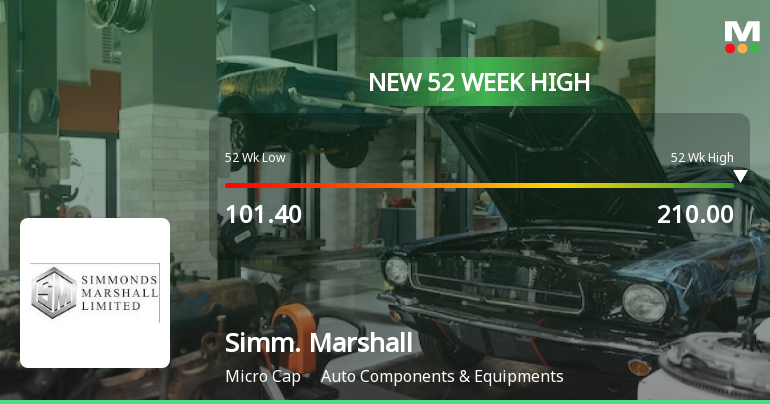
Broad-Based Technical Strength Lifts Simmonds Marshall Ltd to 52-Week High of Rs 210
Surging past its previous peaks, Simmonds Marshall Ltd touched a new 52-week high of Rs 210 on 3 Aug 2026, marking a remarkable 51.08% gain over the past year against the Sensex’s decline of 2.38%. This milestone reflects a strong price momentum supported by a confluence of technical indicators signalling sustained upward movement.
Read full news article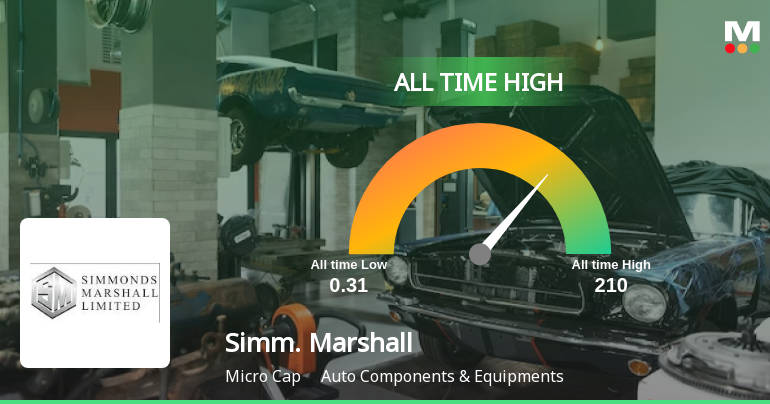
Simmonds Marshall Ltd Hits All-Time High of Rs 210 as Momentum Builds Across Timeframes
Extending its recent rally, Simmonds Marshall Ltd surged 8.16% on 3 Aug 2026 to close at Rs 210, marking a fresh all-time high. This move comes amid strong outperformance versus the Sensex and sustained gains across multiple timeframes, signalling robust momentum in the micro-cap auto components stock.
Read full news article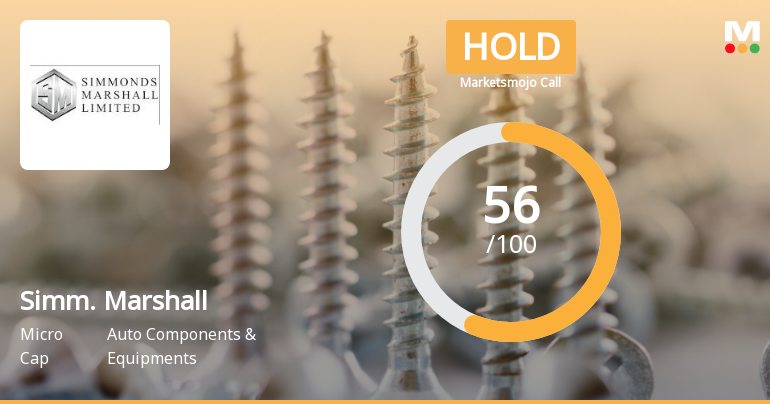
Simmonds Marshall Ltd is Rated Hold
Simmonds Marshall Ltd is rated Hold by MarketsMOJO, with this rating last updated on 06 April 2026. While the rating was revised on that date, the analysis and financial metrics discussed here reflect the company’s current position as of 26 July 2026, providing investors with an up-to-date view of the stock’s fundamentals, valuation, financial trends, and technical outlook.
Read full news article Announcements
Compliances-Certificate under Reg. 74 (5) of SEBI (DP) Regulations 2018
15-Jul-2026 | Source : BSESimmonds Marshall Limited has submitted the certificate under Regulation 74(5) of SEBI (DP) Regulations 2018 for the quarter June 30 2026.
Announcement under Regulation 30 (LODR)-Newspaper Publication
03-Jul-2026 | Source : BSEEnclosed herewith Newspaper Advertisements for Transfer of Equity Shares and Unclaimed Dividend of the Company to IEPF.
Closure of Trading Window
26-Jun-2026 | Source : BSESimmonds Marshall Limited has informed about the Closure of Trading Window
Corporate Actions

No Upcoming Board Meetings

Simmonds Marshall Ltd has declared 25% dividend, ex-date: 05 Sep 19

Simmonds Marshall Ltd has announced 2:10 stock split, ex-date: 29 Mar 10

No Bonus history available

No Rights history available
Quality key factors
Valuation key factors
Technicals key factors
 Technical Indicator Scale: Bearish, Mildly Bearish, Sideways, Mildly Bullish, Bullish Turned
 Shareholding Snapshot : Jun 2026
Shareholding Compare (%holding)
Promoters
None
Held by 0 Schemes
Held by 0 FIIs
Navroze Shiamak Marshall (42.28%)
Zaki Abbas Nasser (4.96%)
31.1%
Quarterly Results Snapshot (Consolidated) - Mar'26 - QoQ

QoQ Growth in quarter ended Mar 2026 is 10.23% vs 2.17% in Dec 2025

QoQ Growth in quarter ended Mar 2026 is 2.07% vs 14.51% in Dec 2025
Half Yearly Results Snapshot (Consolidated) - Sep'25
Growth in half year ended Sep 2025 is 7.37% vs 8.23% in Sep 2024
Growth in half year ended Sep 2025 is 27.27% vs 346.23% in Sep 2024
Nine Monthly Results Snapshot (Consolidated) - Dec'25
YoY Growth in nine months ended Dec 2025 is 11.95% vs 6.89% in Dec 2024
YoY Growth in nine months ended Dec 2025 is 71.24% vs 131.80% in Dec 2024
Annual Results Snapshot (Consolidated) - Mar'26
YoY Growth in year ended Mar 2026 is 14.68% vs 8.10% in Mar 2025
YoY Growth in year ended Mar 2026 is 65.07% vs 174.85% in Mar 2025
About Simmonds Marshall Ltd

Company Coordinates


