
Compare Simplex Castings with Similar Stocks
Dashboard
Healthy long term growth as Operating profit has grown by an annual rate 37.99%
Positive results in Mar 26
With ROCE of 20.8, it has a Attractive valuation with a 2.7 Enterprise value to Capital Employed
Promoter holding has decreased this quarter and now hold 50.36% of the company
Consistent Returns over the last 3 years
Stock DNA
Other Industrial Products
INR 396 Cr (Micro Cap)
18.00
45
0.00%
0.43
19.28%
3.45
Total Returns (Price + Dividend) 
Latest dividend: 0.5 per share ex-dividend date: Sep-12-2018
Risk Adjusted Returns v/s
Returns Beta

News
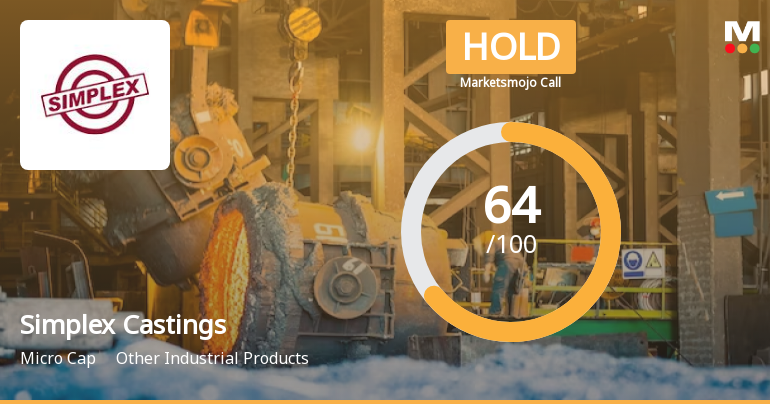
Simplex Castings Ltd is Rated Hold by MarketsMOJO
Simplex Castings Ltd is rated 'Hold' by MarketsMOJO, with this rating last updated on 12 May 2026. However, the analysis and financial metrics discussed here reflect the company’s current position as of 04 June 2026, providing investors with the most up-to-date view of the stock’s fundamentals, returns, and technical outlook.
Read full news article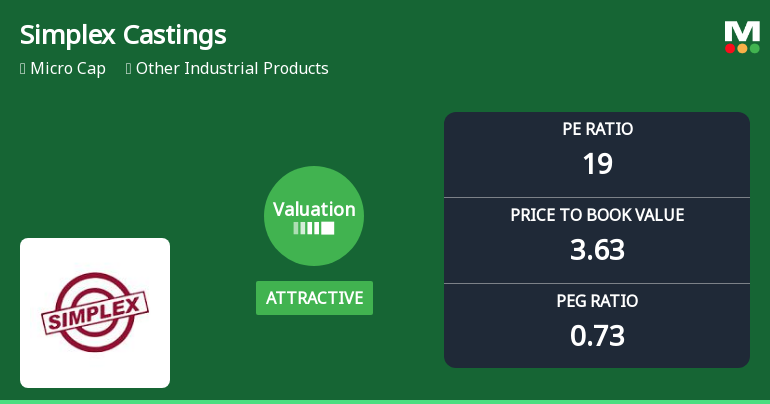
Simplex Castings Ltd Valuation Turns Attractive Amid Strong Market Outperformance
Simplex Castings Ltd has witnessed a notable shift in its valuation parameters, moving from a fair to an attractive rating, supported by robust price-to-earnings and price-to-book value metrics. This re-rating comes alongside impressive stock returns that have significantly outpaced the broader Sensex, signalling renewed investor interest in this micro-cap industrial player.
Read full news article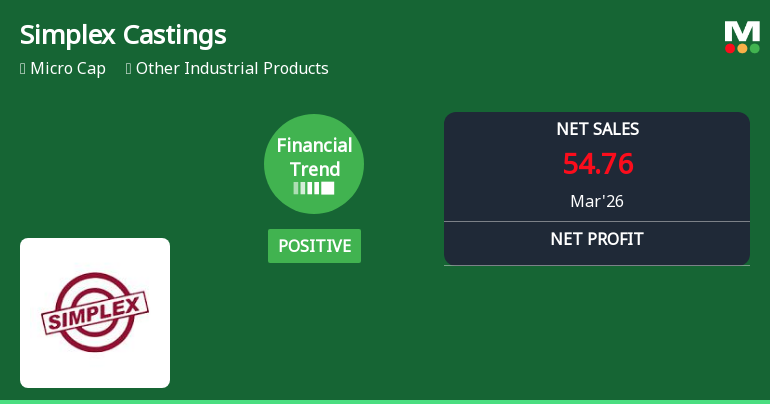
Simplex Castings Ltd Reports Strong Quarterly Profit Despite Sales Decline
Simplex Castings Ltd has demonstrated a notable turnaround in its financial performance for the quarter ended March 2026, registering its highest quarterly profits in recent years despite a significant drop in net sales. The company’s improved profitability metrics and upgraded market rating signal a positive shift in its operational efficiency and financial health.
Read full news article Announcements
Announcement under Regulation 30 (LODR)-Press Release / Media Release
08-Jun-2026 | Source : BSEPlease find attached the press release on Simplex Castings advances green energy transition with 25-Year solar power agreement
Announcement under Regulation 30 (LODR)-Earnings Call Transcript
06-Jun-2026 | Source : BSEPlease find enclosed the Transcript of the Earnings Conference Call held on 29th May 2026
Announcement under Regulation 30 (LODR)-Earnings Call Transcript
06-Jun-2026 | Source : BSEPlease find enclosed the Transcript of the Earnings Conference Call held on 29th May 2026
Corporate Actions

No Upcoming Board Meetings

Simplex Castings Ltd has declared 5% dividend, ex-date: 12 Sep 18

No Splits history available

No Bonus history available

No Rights history available
Quality key factors
Valuation key factors
Technicals key factors
 Technical Indicator Scale: Bearish, Mildly Bearish, Sideways, Mildly Bullish, Bullish Turned
 Shareholding Snapshot : Mar 2026
Shareholding Compare (%holding)
Promoters
None
Held by 0 Schemes
Held by 0 FIIs
Ketan Shah (39.49%)
Areeza India Strategy Partners Llp (4.23%)
30.91%
Quarterly Results Snapshot (Standalone) - Mar'26 - YoY

YoY Growth in quarter ended Mar 2026 is -18.39% vs 113.22% in Mar 2025
YoY Growth in quarter ended Mar 2026 is 66.13% vs 195.24% in Mar 2025
Half Yearly Results Snapshot (Standalone) - Sep'25

Growth in half year ended Sep 2025 is 76.91% vs -7.04% in Sep 2024
Growth in half year ended Sep 2025 is 96.57% vs 707.69% in Sep 2024
Nine Monthly Results Snapshot (Standalone) - Dec'25
YoY Growth in nine months ended Dec 2025 is 41.37% vs 15.59% in Dec 2024
YoY Growth in nine months ended Dec 2025 is 30.68% vs 921.24% in Dec 2024
Annual Results Snapshot (Standalone) - Mar'26
YoY Growth in year ended Mar 2026 is 18.05% vs 40.74% in Mar 2025
YoY Growth in year ended Mar 2026 is 40.52% vs 533.05% in Mar 2025
About Simplex Castings Ltd

Company Coordinates


