
Compare Simplex Infra with Similar Stocks
Dashboard
High Debt company with Weak Long Term Fundamental Strength
- Poor long term growth as Net Sales has grown by an annual rate of -14.23% over the last 5 years
- High Debt Company with a Debt to Equity ratio (avg) of 12.58 times
- The company has been able to generate a Return on Equity (avg) of 0.84% signifying low profitability per unit of shareholders funds
The company has declared Positive results for the last 3 consecutive quarters
With ROCE of 1.1, it has a Very Attractive valuation with a 1.4 Enterprise value to Capital Employed
33.09% of Promoter Shares are Pledged
Total Returns (Price + Dividend) 
Latest dividend: 0.5 per share ex-dividend date: Sep-19-2019
Risk Adjusted Returns v/s
Returns Beta

News

Simplex Infrastructures Ltd is Rated Hold
Simplex Infrastructures Ltd is rated Hold by MarketsMOJO, with this rating last updated on 13 July 2026. While the rating change occurred on that date, the analysis and financial metrics discussed here reflect the company’s current position as of 25 July 2026, providing investors with the most up-to-date view of the stock’s fundamentals, valuation, financial trends, and technical outlook.
Read full news article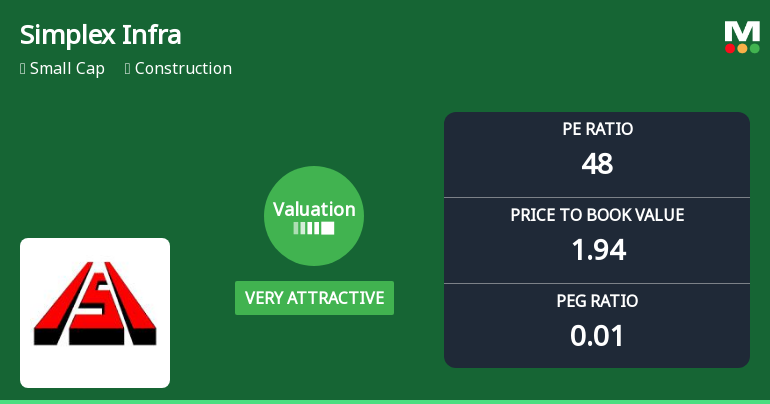
Simplex Infrastructures Ltd Valuation Shifts to Very Attractive Amid Market Volatility
Simplex Infrastructures Ltd has witnessed a significant shift in its valuation parameters, moving from an attractive to a very attractive rating, despite recent share price declines and broader market pressures. This change reflects evolving investor sentiment and a reassessment of the company’s price-to-earnings and price-to-book value metrics relative to its historical averages and peer group.
Read full news article
Simplex Infrastructures Ltd Upgraded to Hold on Improved Technicals and Financial Trends
Simplex Infrastructures Ltd has seen its investment rating upgraded from Sell to Hold, driven primarily by a shift in technical indicators and improving financial trends. Despite lingering concerns over long-term fundamentals and high debt levels, recent quarterly results and valuation metrics have prompted a reassessment of the stock’s outlook within the construction sector.
Read full news article Announcements
Announcement under Regulation 30 (LODR)-Newspaper Publication
20-Jul-2026 | Source : BSEIntimation Regarding Publication of IEPF Notice in Newspaper
Compliances-Certificate under Reg. 74 (5) of SEBI (DP) Regulations 2018
10-Jul-2026 | Source : BSESubmission of Compliance Certificate under Regulation 74(5) of SEBI (Depositories and Participants) Regulations2018 for the quarter ended 30th June 2026
Closure of Trading Window
26-Jun-2026 | Source : BSEiIntimation of closure of Trading Window with effect from 1st July2026 till 48 hours after the declaration of Financial Results of the Company for the 1st quarter ended 30th june 2026
Corporate Actions

No Upcoming Board Meetings

Simplex Infrastructures Ltd has declared 25% dividend, ex-date: 19 Sep 19

Simplex Infrastructures Ltd has announced 2:10 stock split, ex-date: 13 Sep 06

No Bonus history available

No Rights history available
Quality key factors
Valuation key factors
Technicals key factors
 Technical Indicator Scale: Bearish, Mildly Bearish, Sideways, Mildly Bullish, Bullish Turned
 Shareholding Snapshot : Jun 2026
Shareholding Compare (%holding)
Non Institution
33.093
Held by 1 Schemes (4.59%)
Held by 18 FIIs (0.39%)
Baba Basuki Distributors (p) Ltd (13.65%)
National Asset Reconstruction Company Ltd (16.24%)
18.47%
Quarterly Results Snapshot (Consolidated) - Mar'26 - YoY

YoY Growth in quarter ended Mar 2026 is 0.34% vs -21.85% in Mar 2025
YoY Growth in quarter ended Mar 2026 is -56.33% vs -73.53% in Mar 2025
Half Yearly Results Snapshot (Consolidated) - Sep'25
Growth in half year ended Sep 2025 is -13.00% vs -20.73% in Sep 2024
Growth in half year ended Sep 2025 is 163.68% vs 86.89% in Sep 2024
Nine Monthly Results Snapshot (Consolidated) - Dec'25
YoY Growth in nine months ended Dec 2025 is -6.98% vs -22.77% in Dec 2024
YoY Growth in nine months ended Dec 2025 is 166.04% vs 86.52% in Dec 2024
Annual Results Snapshot (Consolidated) - Mar'26
YoY Growth in year ended Mar 2026 is -5.06% vs -22.53% in Mar 2025
YoY Growth in year ended Mar 2026 is 245.51% vs 116.02% in Mar 2025
About Simplex Infrastructures Ltd

Company Coordinates


