
Compare Simplex Papers with Similar Stocks
Dashboard
With a Negative Book Value, the company has a Weak Long Term Fundamental Strength
- Poor long term growth as Net Sales has grown by an annual rate of % and Operating profit at 0% over the last 5 years
- The company has a negative book value of Rs 12.17 crore
Flat results in Mar 26
Risky - Negative EBITDA
Stock DNA
Paper, Forest & Jute Products
INR 4 Cr (Micro Cap)
NA (Loss Making)
8
0.00%
-1.02
1.31%
-0.31
Total Returns (Price + Dividend) 
Simplex Papers for the last several years.
Risk Adjusted Returns v/s
Returns Beta

News
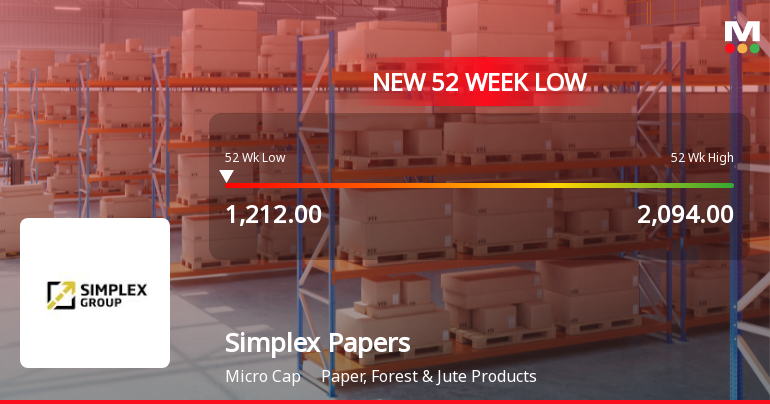
Simplex Papers Ltd Falls to 52-Week Low of Rs 1212 as Sell-Off Deepens
A sharp decline of 4.57% today dragged Simplex Papers Ltd to a fresh 52-week low of Rs 1212, marking a significant 42% drop from its peak of Rs 2094 in the past year. This latest fall extends the stock’s underperformance amid a broader market that has shown some resilience.
Read full news article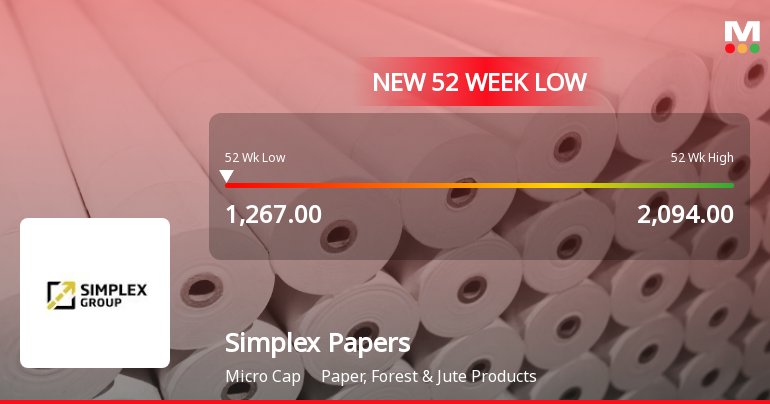
Are Simplex Papers Ltd latest results good or bad?
The latest financial results for Simplex Papers Ltd highlight a concerning operational reality, as the company has not generated any revenue for the past seven consecutive quarters. In Q4 FY26, the company reported a net loss of ₹0.02 crores, which represents a reduction from the ₹0.03 crores loss in the previous quarter, but this change is attributed to a decrease in operational expenses rather than any recovery in business activities. The company's balance sheet reveals significant challenges, with negative shareholder equity of ₹12.05 crores and a book value per share of negative ₹4,012.34. Current liabilities substantially exceed current assets, indicating a severe working capital deficit. The absence of revenue generation means that traditional profitability metrics remain undefined, and the return on capital employed stands at a negative 17.00%, reflecting ongoing capital inefficiency. Despite thes...
Read full news article Announcements
Announcement under Regulation 30 (LODR)-Change in Directorate
20-May-2026 | Source : BSEChange in Designation of Fatima Fernandes as Non executive Independent Director
Announcement under Regulation 30 (LODR)-Newspaper Publication
20-May-2026 | Source : BSEAudited financial results for the year ended 31.03.2026
Board Meeting Outcome for Audited Financial Results For The Year 31.03.2026
19-May-2026 | Source : BSEAudited Financial result for the year ended 31.03.26
Corporate Actions

No Upcoming Board Meetings

No Dividend history available

Simplex Papers Ltd has announced 1000:10 stock split, ex-date: 26 May 23

No Bonus history available

No Rights history available
Quality key factors
Valuation key factors
Technicals key factors
 Technical Indicator Scale: Bearish, Mildly Bearish, Sideways, Mildly Bullish, Bullish Turned
 Shareholding Snapshot : Mar 2026
Shareholding Compare (%holding)
Promoters
None
Held by 1 Schemes (0.0%)
Held by 0 FIIs
Simplex Realty Limited (49.01%)
Life Insurance Corporation Of India (12.24%)
34.01%
Quarterly Results Snapshot (Standalone) - Mar'26 - QoQ
QoQ Growth in quarter ended Mar 2026 is 0.00% vs 0.00% in Dec 2025

QoQ Growth in quarter ended Mar 2026 is 33.33% vs 0.00% in Dec 2025
Half Yearly Results Snapshot (Standalone) - Sep'25
Growth in half year ended Sep 2025 is 0.00% vs 0.00% in Sep 2024
Growth in half year ended Sep 2025 is 25.00% vs -140.00% in Sep 2024
Nine Monthly Results Snapshot (Standalone) - Dec'25
YoY Growth in nine months ended Dec 2025 is 0.00% vs 0.00% in Dec 2024
YoY Growth in nine months ended Dec 2025 is 18.18% vs -173.33% in Dec 2024
Annual Results Snapshot (Standalone) - Mar'26
YoY Growth in year ended Mar 2026 is 0.00% vs 0.00% in Mar 2025
YoY Growth in year ended Mar 2026 is 31.25% vs -245.45% in Mar 2025
About Simplex Papers Ltd


