
 Price Point
Compare Sindhu Trade with Similar Stocks
ScoreDashboard
Weak Long Term Fundamental Strength with an average Return on Equity (ROE) of 3.11%
- Poor long term growth as Net Sales has grown by an annual rate of -11.76% and Operating profit at -3.95%
With ROE of 3.3, it has a Very Expensive valuation with a 2.1 Price to Book Value
Despite the size of the company, domestic mutual funds hold only 0% of the company


 Total Returns
Total Returns (Price + Dividend) 
Sindhu Trade for the last several years.
Risk Adjusted Returns v/s
Returns Beta
 News & Corporate Actions
News
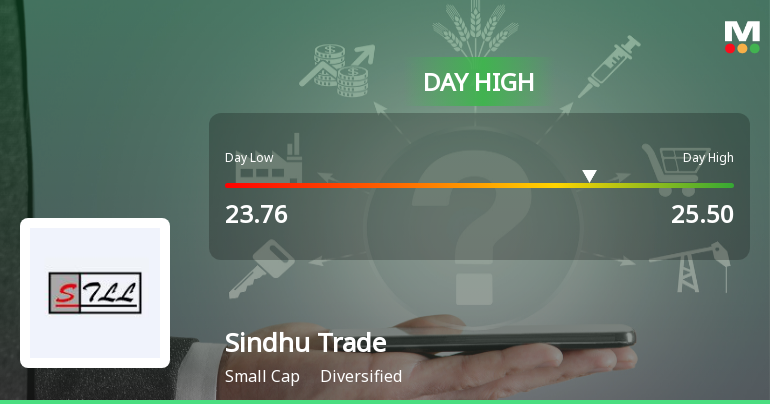
Sindhu Trade Links Ltd Surges 7.04% to Day's High of Rs 25.36 — Outperforms Sector by 5.08 Percentage Points
While the Sensex edged lower by 0.04% on 26 Aug 2026, Sindhu Trade Links Ltd surged 7.04%, hitting an intraday high of Rs 25.36. This 5.08 percentage-point outperformance over its Diversified sector peers highlights a distinctly stock-specific rally rather than a market-wide lift.
Read full news article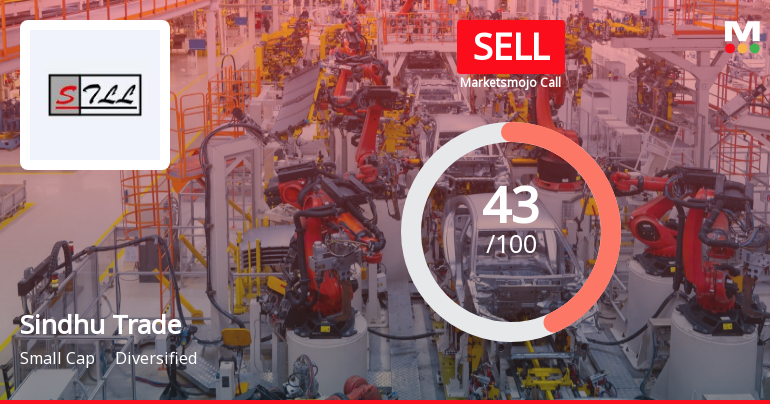
Sindhu Trade Links Ltd is Rated Sell
Sindhu Trade Links Ltd is rated 'Sell' by MarketsMOJO, with this rating last updated on 14 August 2026. However, the analysis and financial metrics discussed here reflect the stock's current position as of 19 August 2026, providing investors with an up-to-date view of the company’s fundamentals, valuation, financial trends, and technical outlook.
Read full news article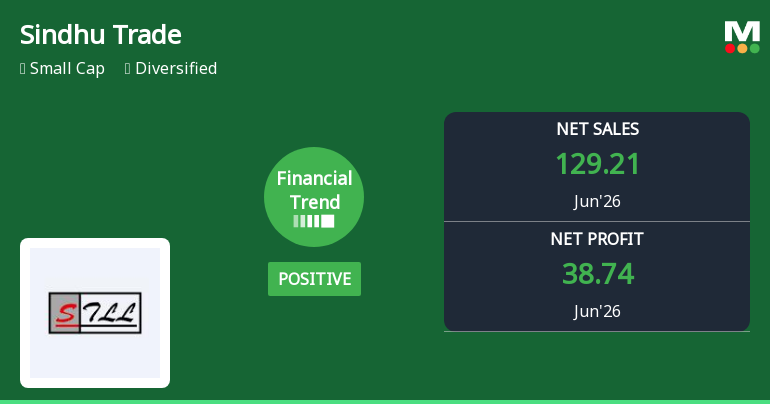
Sindhu Trade Links Ltd Reports Strong Quarterly Turnaround Amid Mixed Sales Trends
Sindhu Trade Links Ltd has demonstrated a notable financial turnaround in the quarter ended June 2026, shifting from a negative to a positive trend in key performance metrics. Despite challenges in sales growth and debtor efficiency, the company posted record highs in profitability and earnings per share, signalling a potential inflection point for this small-cap diversified player.
Read full news article Announcements
Announcement under Regulation 30 (LODR)-Newspaper Publication
14-Aug-2026 | Source : BSEPublication of Financial Result for the Quarter ending on 30th June 2026
Intimation Under Regulation 33 & 30 Of The SEBI (Listing Obligation And Disclosure Requirements) Regulations 2015/ Outcome Of The Board Meeting
13-Aug-2026 | Source : BSEIn compliance with Regulation 30 of SEBI (LODR) Regulations 2015 it is hereby informed that the Board of Director approved the following:
Integrated Filing - Fianncials Of The Company For The Quarter Ending On 30Th June 2026
13-Aug-2026 | Source : BSEPursuant to the SEBI circular no. SEBI/HO/CFD/CFD-PoD-2/CIR/P/2024/185 dated December 31st 2024 read with BSE Circular No. 20250102-4 and NSE Circular No. NSE/CML/2025/02 both dated January 02 2025 we are hereby submitting the Integrated Filing for the quarter ended on 30th June 2026
Corporate Actions

No Upcoming Board Meetings

No Dividend history available

Sindhu Trade Links Ltd has announced 1:10 stock split, ex-date: 03 Feb 22

Sindhu Trade Links Ltd has announced 2:1 bonus issue, ex-date: 19 May 22

No Rights history available
Key FactorsQuality key factors
Valuation key factors
Technicals key factors
 Technical Indicator Scale: Bearish, Mildly Bearish, Sideways, Mildly Bullish, Bullish Turned Shareholding
Shareholding Snapshot : Jun 2026
Shareholding Compare (%holding)
Promoters
0.2761
Held by 1 Schemes (0.0%)
Held by 20 FIIs (3.17%)
Paramitra Holdings Private Limited (14.79%)
Fine Grow Buildcon Private Limited (2.25%)
15.3%
FinancialQuarterly Results Snapshot (Consolidated) - Jun'26 - QoQ
 Compare with Peers
QoQ Growth in quarter ended Jun 2026 is 12.10% vs -3.26% in Mar 2026
QoQ Growth in quarter ended Jun 2026 is 177.51% vs 0.65% in Mar 2026

Half Yearly Results Snapshot (Consolidated) - Sep'25

Growth in half year ended Sep 2025 is -68.64% vs 12.08% in Sep 2024
Growth in half year ended Sep 2025 is -84.25% vs 136.23% in Sep 2024
Nine Monthly Results Snapshot (Consolidated) - Dec'25
YoY Growth in nine months ended Dec 2025 is -71.50% vs 15.65% in Dec 2024
YoY Growth in nine months ended Dec 2025 is -75.92% vs 4.53% in Dec 2024
Annual Results Snapshot (Consolidated) - Mar'26
YoY Growth in year ended Mar 2026 is -69.73% vs 2.67% in Mar 2025
YoY Growth in year ended Mar 2026 is -52.76% vs 71.81% in Mar 2025
 Company CV
About Sindhu Trade Links Ltd

Company Coordinates










