
Compare Sindhu Trade with Similar Stocks
Dashboard
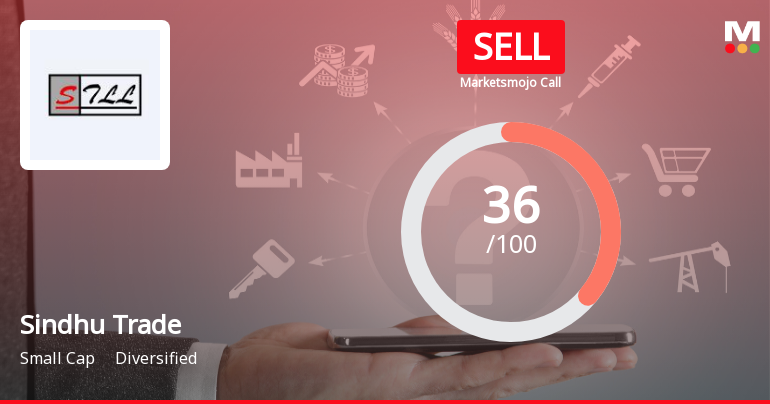
Weak Long Term Fundamental Strength with an average Return on Equity (ROE) of 3.11%
- Poor long term growth as Net Sales has grown by an annual rate of -10.11% and Operating profit at -2.91%
The company has declared Negative results for the last 5 consecutive quarters
With ROE of 3.3, it has a Very Expensive valuation with a 2.2 Price to Book Value
Despite the size of the company, domestic mutual funds hold only 0% of the company
Total Returns (Price + Dividend) 
Sindhu Trade for the last several years.
Risk Adjusted Returns v/s
Returns Beta

News
Sindhu Trade Links Ltd Upgraded to Sell Amid Mixed Technical and Valuation Signals
Sindhu Trade Links Ltd has seen its investment rating upgraded from Strong Sell to Sell as of 2 June 2026, driven primarily by a marked improvement in technical indicators. However, the company continues to face challenges in valuation and financial performance, which temper the overall outlook despite recent market-beating returns.
Read full news article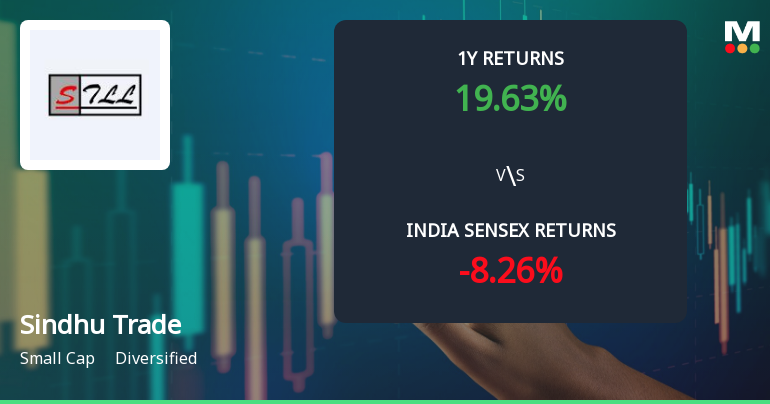
Sindhu Trade Links Ltd Shows Bullish Momentum Amid Mixed Technical Signals
Sindhu Trade Links Ltd has experienced a notable shift in its technical momentum, moving from a mildly bullish stance to a more confident bullish trend. Despite this positive directional change, the stock presents a complex picture with mixed signals from key technical indicators such as MACD, RSI, and moving averages, warranting a nuanced analysis for investors navigating the diversified sector.
Read full news articleAre Sindhu Trade Links Ltd latest results good or bad?
The latest financial results for Sindhu Trade Links Ltd for the March 2026 quarter reveal significant challenges, particularly in revenue generation. The company reported net sales of ₹115.26 crores, reflecting a sequential decline of 3.26% from the previous quarter and a substantial year-on-year drop of 61.24%. This marks the fourth consecutive quarter of sequential revenue decline, indicating a troubling trend in the company's ability to maintain its sales momentum. Despite the revenue contraction, Sindhu Trade Links managed to maintain profitability, with a consolidated net profit of ₹13.96 crores, which showed a slight sequential increase of 0.65%. The company's profit after tax (PAT) margin improved to 12.11%, up from 11.64% in the previous quarter, suggesting enhanced operational efficiency and cost management during this period. Additionally, the operating profit margin (excluding other income) rose...
Read full news article Announcements
Announcement under Regulation 30 (LODR)-Meeting Updates
30-May-2026 | Source : BSEIntegrated Filing as on 31st March 2026
Intimation Under Regulation 33 & 30 Of The SEBI (Listing Obligation And Disclosure Requirements) Regulations 2015/ Outcome Of The Board Meeting.
30-May-2026 | Source : BSEIn Compliance with Regulation 30 & 33 of SEBI (LODR) Regulations 2015 it is hereby informed that the Board of Directors of the Company has approved the following: 1. Considered and approved the Audited Standalone & Consolidated Results for the Financial Year ended on 31st March 2026 alngwith Statement of Assets & Liability and Cash Flow Statement as on 31st March 2026. 2. Taken on record the Audit Report pursuant to Regulation 33 of SEBI (LODR) regulations 2015 submitted by the Auditors of the Company.
Board Meeting Outcome for Intimation Under Regulation 33 & 30 Of The SEBI (Listing Obligation And Disclosure Requirements) Regulations 2015/ Outcome Of The Board Meeting.
30-May-2026 | Source : BSEIn compliance with regulation 30 & 33 of SEBI (Listing Obligation and Disclosure Requirements) Regulations 2015 it is hereby informed that the Board of Directors of the Company in its meeting held on 30th May 2026 has considered and approved the following matters: 1. Considered and Approved the Audited Financial Results (Standalone & Consolidated) of the Company for the Quarter / Financial year ended on 31st March 2026 alongwith Statement of Assets & Liabilities and Cash Flow Statement as on 31st March 2026. 2. Taken on record the Audit Report (Standalone & Consolidated) pursuant to Regulation 33 of the SEBI (Listing Obligation & Disclosure Requirements) Regulations 2015 submitted by the Statutory Auditors of the Company. The Meeting commenced at 04.00 P.M. and concluded at 04.45 P.M
Corporate Actions

No Upcoming Board Meetings

No Dividend history available

Sindhu Trade Links Ltd has announced 1:10 stock split, ex-date: 03 Feb 22

Sindhu Trade Links Ltd has announced 2:1 bonus issue, ex-date: 19 May 22

No Rights history available
Quality key factors
Valuation key factors
Technicals key factors
 Technical Indicator Scale: Bearish, Mildly Bearish, Sideways, Mildly Bullish, Bullish Turned
 Shareholding Snapshot : Mar 2026
Shareholding Compare (%holding)
Promoters
0.2761
Held by 1 Schemes (0.0%)
Held by 14 FIIs (3.18%)
Paramitra Holdings Private Limited (14.79%)
Fine Grow Buildcon Private Limited (2.25%)
13.88%
Quarterly Results Snapshot (Consolidated) - Mar'26 - QoQ

QoQ Growth in quarter ended Mar 2026 is -3.26% vs -4.17% in Dec 2025

QoQ Growth in quarter ended Mar 2026 is 0.65% vs 28.19% in Dec 2025
Half Yearly Results Snapshot (Consolidated) - Sep'25
Growth in half year ended Sep 2025 is -68.64% vs 12.08% in Sep 2024
Growth in half year ended Sep 2025 is -84.25% vs 136.23% in Sep 2024
Nine Monthly Results Snapshot (Consolidated) - Dec'25
YoY Growth in nine months ended Dec 2025 is -71.50% vs 15.65% in Dec 2024
YoY Growth in nine months ended Dec 2025 is -75.92% vs 4.53% in Dec 2024
Annual Results Snapshot (Consolidated) - Mar'26
YoY Growth in year ended Mar 2026 is -69.73% vs 2.67% in Mar 2025
YoY Growth in year ended Mar 2026 is -52.76% vs 71.81% in Mar 2025
About Sindhu Trade Links Ltd

Company Coordinates


