
 Score
ScoreDashboard
Weak Long Term Fundamental Strength with a -1.00% CAGR growth in Net Sales over the last 5 years
- Company's ability to service its debt is weak with a poor EBIT to Interest (avg) ratio of -0.19
- The company has been able to generate a Return on Equity (avg) of 2.66% signifying low profitability per unit of shareholders funds
Flat results in Jun 26
Risky - Negative EBITDA


 Total Returns
Total Returns (Price + Dividend) 
Sinnar Bidi Udy. for the last several years.
Risk Adjusted Returns v/s
Returns Beta
 News & Corporate Actions
News
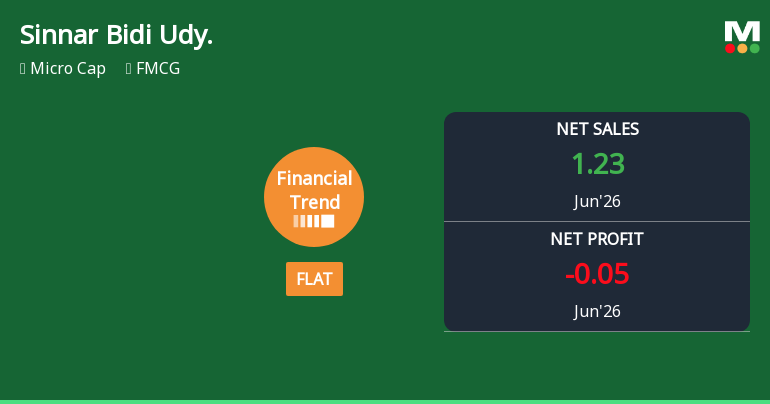
Sinnar Bidi Udyog Ltd Reports Stabilised Quarterly Performance Amid Market Challenges
Sinnar Bidi Udyog Ltd, a micro-cap player in the FMCG sector, reported a flat financial performance for the quarter ended June 2026, marking a notable improvement from previous quarters. Despite a challenging market environment and a recent downgrade to a Strong Sell rating by MarketsMOJO, the company’s financial trend has stabilised, reflecting a shift from negative to neutral territory.
Read full news articleAre Sinnar Bidi Udyog Ltd latest results good or bad?
Sinnar Bidi Udyog Ltd's latest financial results reflect a challenging operational landscape. In Q4 FY26, the company reported a net loss of ₹0.37 crores, which represents a significant deterioration compared to the previous year. Despite a 22.45% year-on-year increase in revenue to ₹1.20 crores, this growth did not translate into profitability, as the operating margin fell to -30.0%, marking the lowest performance in seven quarters. The company's return on equity (ROE) was reported at -3.29%, indicating ongoing struggles to generate shareholder value. In the subsequent quarter, June 2026, Sinnar Bidi Udyog experienced a modest year-on-year revenue growth of 4.24%, reaching ₹1.18 crores. However, the consolidated net profit showed a substantial decline of -171.43%, resulting in a loss of ₹0.05 crores. The operating profit margin remained at 3.25%, suggesting that while there was some revenue growth, the ov...
Read full news article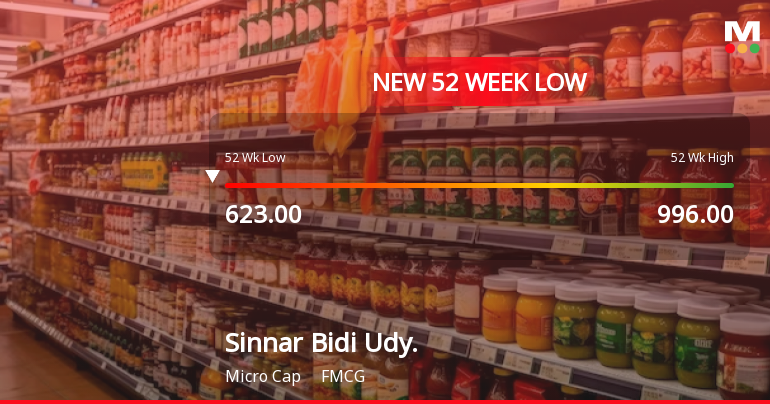
Sinnar Bidi Udyog Ltd Falls to 52-Week Low Amid Persistent Losses and Weak Fundamentals
A sharp decline has pushed Sinnar Bidi Udyog Ltd to its lowest price in 52 weeks, reflecting ongoing financial strain and a challenging valuation backdrop despite some recent trading volatility.
Read full news article Announcements
Announcement Under Regulation 30 Of SEBI LODR_Update On Change In Desigantion Of Independent Director
23-Sep-2026 | Source : BSEPursuant to Regulation 30 of SEBI LODR Regulation 2015 The regularisation of Addtional Non- Executive Independent Director Mr. Sachin Jagdish Laddha has been approved in 52nd AGM held on Wednesday 23 September 2026. The Designation after his regularisation is Non-Executive Independent Director. The term of Appointment is 5 years w.e.f 14 August 2026.
Shareholder Meeting / Postal Ballot-Outcome of AGM
23-Sep-2026 | Source : BSEPursuant to Regulation 30 of SEBI LODR Regulation 2015 Summary of proceedings of 52nd AGM held on Wednesday 23.09.2026 is attached herewith.
Announcement under Regulation 30 (LODR)-Newspaper Publication
31-Aug-2026 | Source : BSEThe newspapers advertiesment of 52nd AGM of the Company publised in Free Press Journal & Navshakti on 31 August 2026 is attached herewith.
Corporate Actions

No Upcoming Board Meetings

No Dividend history available

Sinnar Bidi Udyog Ltd has announced 5:10 stock split, ex-date: 30 Jul 19

No Bonus history available

No Rights history available
Key FactorsQuality key factors
Valuation key factors
Technicals key factors
 Technical Indicator Scale: Bearish, Mildly Bearish, Sideways, Mildly Bullish, Bullish Turned Shareholding
Shareholding Snapshot : Jun 2026
Shareholding Compare (%holding)
Promoters
None
Held by 0 Schemes
Held by 0 FIIs
Rasbihari Enterprises Private Limited (29.2%)
Mandar Ganesh Rajendra (1.3%)
24.85%
FinancialQuarterly Results Snapshot (Consolidated) - Jun'26 - YoY
 Compare with Peers
YoY Growth in quarter ended Jun 2026 is 4.24% vs -9.92% in Jun 2025

YoY Growth in quarter ended Jun 2026 is -171.43% vs 150.00% in Jun 2025

Half Yearly Results Snapshot (Consolidated) - Sep'25
Growth in half year ended Sep 2025 is 26.87% vs -3.40% in Sep 2024
Growth in half year ended Sep 2025 is 293.75% vs -194.12% in Sep 2024
Nine Monthly Results Snapshot (Consolidated) - Dec'25
YoY Growth in nine months ended Dec 2025 is 0.53% vs 5.34% in Dec 2024
YoY Growth in nine months ended Dec 2025 is 366.67% vs -139.13% in Dec 2024
Annual Results Snapshot (Consolidated) - Mar'26
YoY Growth in year ended Mar 2026 is 5.29% vs -1.46% in Mar 2025
YoY Growth in year ended Mar 2026 is -8.33% vs -200.00% in Mar 2025
 Company CV
About Sinnar Bidi Udyog Ltd










