
Compare Sintercom India with Similar Stocks
Stock DNA
Auto Components & Equipments
INR 197 Cr (Micro Cap)
139.00
35
0.00%
0.51
1.39%
1.91
Total Returns (Price + Dividend) 
Sintercom India for the last several years.
Risk Adjusted Returns v/s
Returns Beta

News
Sintercom India Ltd is Rated Sell
Sintercom India Ltd is rated 'Sell' by MarketsMOJO, with this rating last updated on 14 Nov 2025. However, the analysis and financial metrics discussed here reflect the stock's current position as of 29 May 2026, providing investors with an up-to-date view of the company’s fundamentals, returns, and market standing.
Read full news article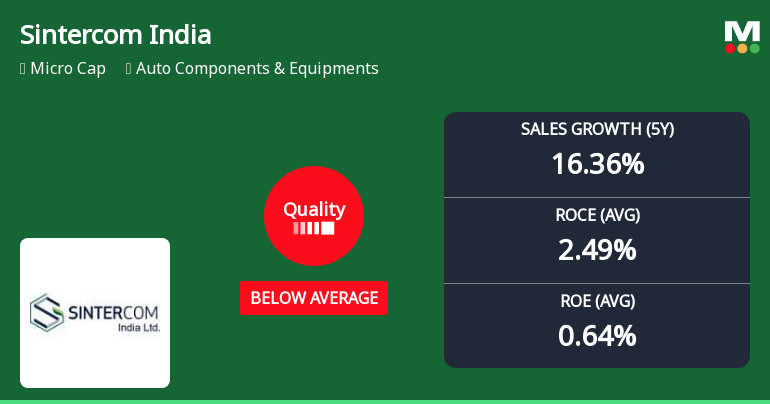
Sintercom India Ltd Quality Parameters Deteriorate Amidst Mixed Financial Performance
Sintercom India Ltd, a micro-cap player in the Auto Components & Equipments sector, has seen its quality grade downgraded from average to below average as of 14 Nov 2025, reflecting deteriorating business fundamentals. Despite a recent uptick in share price by 4.25% to ₹79.79, the company faces significant challenges in profitability, capital efficiency, and debt management, which have weighed on investor confidence and long-term returns.
Read full news article
Sintercom India Ltd is Rated Sell
Sintercom India Ltd is rated 'Sell' by MarketsMOJO, with this rating last updated on 14 Nov 2025. However, the analysis and financial metrics discussed here reflect the stock's current position as of 18 May 2026, providing investors with an up-to-date perspective on the company’s performance and outlook.
Read full news article Announcements
Sintercom India Limited - Updates
21-Nov-2019 | Source : NSESintercom India Limited has informed the Exchange regarding 'The Company received "SME Business Excellence Awards 2019- Make in India category organised by Dun & Bradstreet RBL Bank'.
Sintercom India Limited - Financial Results Updates
13-Nov-2019 | Source : NSESintercom India Limited has submitted to the Exchange a copy of the financial results for the period ended September 30, 2019.
Sintercom India Limited - Analysts/Institutional Investor Meet/Con. Call Updates
08-Nov-2019 | Source : NSESintercom India Limited has informed the Exchange regarding Analysts/Institutional Investor Meet/Con. Call Updates
Corporate Actions

No Upcoming Board Meetings

No Dividend history available

No Splits history available

No Bonus history available

No Rights history available
Quality key factors
Valuation key factors
Technicals key factors
 Technical Indicator Scale: Bearish, Mildly Bearish, Sideways, Mildly Bullish, Bullish Turned
 Shareholding Snapshot : Mar 2026
Shareholding Compare (%holding)
Promoters
5.9019
Held by 0 Schemes
Held by 0 FIIs
Brn Industries Limited (34.34%)
Meenakshi Mercantiles Ltd (3.05%)
20.36%
Quarterly Results Snapshot (Standalone) - Mar'26 - YoY

YoY Growth in quarter ended Mar 2026 is 14.14% vs 2.64% in Mar 2025
YoY Growth in quarter ended Mar 2026 is 960.00% vs -89.36% in Mar 2025
Half Yearly Results Snapshot (Standalone) - Sep'25
Growth in half year ended Sep 2025 is 13.38% vs 2.10% in Sep 2024
Growth in half year ended Sep 2025 is 170.00% vs -28.57% in Sep 2024
Nine Monthly Results Snapshot (Standalone) - Dec'25
YoY Growth in nine months ended Dec 2025 is 11.03% vs 2.63% in Dec 2024
YoY Growth in nine months ended Dec 2025 is 46.77% vs -8.82% in Dec 2024
Annual Results Snapshot (Standalone) - Mar'26
YoY Growth in year ended Mar 2026 is 11.88% vs 2.62% in Mar 2025
YoY Growth in year ended Mar 2026 is 113.43% vs -41.74% in Mar 2025
About Sintercom India Ltd

Company Coordinates


