
Compare SKIL Infrastr with Similar Stocks
Dashboard
Weak Long Term Fundamental Strength as the company has not declared results in the last 6 months
- Poor long term growth as Net Sales has grown by an annual rate of 0% and Operating profit at 0% over the last 5 years
- The company is Net-Debt Free
Flat results in Jun 24
Risky - No result in last 6 months
Total Returns (Price + Dividend) 

Risk Adjusted Returns v/s
Returns Beta
News
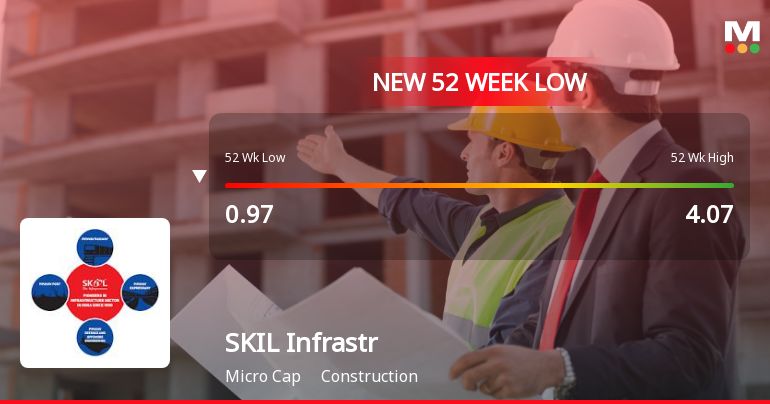
SKIL Infrastructure Ltd Falls to 52-Week Low of Rs 0.81 as Sell-Off Deepens
For the fifth consecutive session, SKIL Infrastructure Ltd closed lower, hitting a fresh 52-week low of Rs 0.81 on 13 Apr 2026, marking a steep decline of 78.28% over the past year despite a modest 2.02% gain in the Sensex during the same period.
Read full news article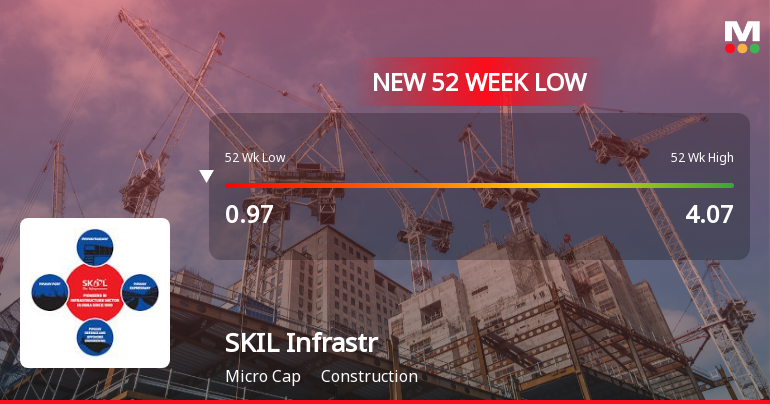
SKIL Infrastructure Ltd Falls to 52-Week Low of Rs 0.85 as Sell-Off Deepens
For the fifth consecutive session, SKIL Infrastructure Ltd closed lower, hitting a fresh 52-week low of Rs 0.85 on 6 Apr 2026, marking a steep 78.75% decline over the past year against a Sensex fall of just 3.14%.
Read full news article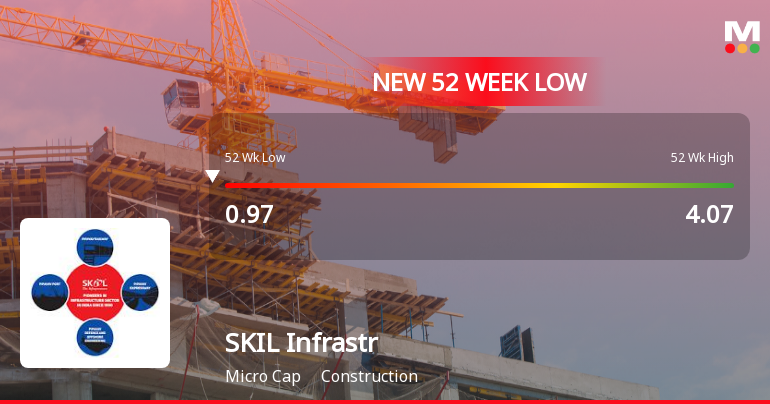
Announcements
SKIL Infrastructure Limited - Outcome of Board Meeting
14-Nov-2019 | Source : NSESKIL Infrastructure Limited has informed the Exchange regarding Board meeting held on November 13, 2019.
SKIL Infrastructure Limited - Updates
05-Nov-2019 | Source : NSESKIL Infrastructure Limited has informed the Exchange regarding 'With reference to captioned subject, enclosed herewith are the Newspaper Clippings of Notice of Board Meeting scheduled to be held on Wednesday, November 13, 2019, published in Business Standard (English Daily) and Mumbai Lakshadeep (Marathi Daily) on November 01, 2019. The same is in compliances with Regulation 47 of the SEBI (Listing Obligations and Disclosure Requirements) Regulations, 2015.
Updates
05-Sep-2019 | Source : NSE
| SKIL Infrastructure Limited has informed the Exchange regarding 'With reference to the captioned subject, please note that due to oversight, Closure of Register and Share Transfer Books of the Company for Annual General Meeting purpose was mentioned from Saturday, September 21, 2019 to Monday, September 30, 2019 instead of Tuesday, September 24, 2019 to Monday, September 30, 2019.Thus you are requested to kindly take on record Closure of Register and Share Transfer Books of the Company from Tuesday, September 24, 2019 to Monday, September 30, 2019.'. |
Corporate Actions

No Upcoming Board Meetings

SKIL Infrastructure Ltd has declared 10% dividend, ex-date: 23 Sep 13

No Splits history available

No Bonus history available

No Rights history available
Quality key factors
Valuation key factors
Technicals key factors
 Technical Indicator Scale: Bearish, Mildly Bearish, Sideways, Mildly Bullish, Bullish Turned
 Shareholding Snapshot : Sep 2023
Shareholding Compare (%holding)
Promoters
69.8166
Held by 0 Schemes
Held by 3 FIIs (6.66%)
Metropolitan Industries (30.96%)
Ashoka Investment Holdings Limited (5.21%)
25.6%
Quarterly Results Snapshot (Standalone) - Jun'24 - QoQ
QoQ Growth in quarter ended Jun 2024 is 0.00% vs 0.00% in Mar 2024

QoQ Growth in quarter ended Jun 2024 is 92.08% vs 9.62% in Mar 2024
Half Yearly Results Snapshot (Consolidated) - Sep'23
Growth in half year ended Sep 2023 is 0.00% vs 0.00% in Sep 2022
Growth in half year ended Sep 2023 is 148.34% vs 73.10% in Sep 2022
Nine Monthly Results Snapshot (Consolidated) - Dec'23
YoY Growth in nine months ended Dec 2023 is 0.00% vs 0.00% in Dec 2022

YoY Growth in nine months ended Dec 2023 is -95.46% vs 288.27% in Dec 2022
Annual Results Snapshot (Consolidated) - Mar'24
YoY Growth in year ended Mar 2024 is 0.00% vs 0.00% in Mar 2023
YoY Growth in year ended Mar 2024 is -99.20% vs 794.45% in Mar 2023
About SKIL Infrastructure Ltd

Company Coordinates


