SKP Securities

  • Market Cap: Micro Cap
  • Industry: Non Banking Financial Company (NBFC)
  • ISIN: INE709B01016
  • NSEID:
  • BSEID: 531169
INR
97.00
-2.1 (-2.12%)
BSENSE

Feb 13

BSE+NSE Vol: 2.85 k

  • Price Points
  • Score
  • Mojo Parameters
  • Total Return
  • News and Corporate Actions
  • Key factors
  • Shareholding
  • Financials
  • CompanyCV
stock-summaryPrice Point
High/Low

1Day

52 Week

Valuation
Technical
Day's Volume

CASH

2.85 k (161.73%) Volume

Shareholding (Dec 2025)

FII

0.00%

Held by 0 FIIs

DII

0.28%

Held by 0 DIIs

Promoter

74.99%

Who are the top shareholders of the SKP Securities?

06-Jun-2025

The top shareholders of SKP Securities are Naresh Pachisia with 26.23%, followed by Vinita Bangur at 6.82%, and individual investors who collectively own 22.11%. There are no mutual funds or foreign institutional investors holding shares in the company.

The top shareholders of SKP Securities include Naresh Pachisia, who holds the largest stake at 26.23%. Following him, the highest public shareholder is Vinita Bangur, with a holding of 6.82%. Additionally, individual investors collectively own 22.11% of the company. There are no mutual funds or foreign institutional investors currently holding shares in SKP Securities.

View full answer

What does SKP Securities do?

06-Jun-2025

SKP Securities Ltd is a micro-cap NBFC focused on stock broking, depository services, and financial advisory. As of March 2025, it reported net sales of 8 Cr and a net profit of 1 Cr, with a market cap of Rs 77 Cr.

Overview: <BR>SKP Securities Ltd is a Non Banking Financial Company (NBFC) in the micro-cap category, primarily engaged in stock broking, depository participant services, and various financial advisory activities.<BR><BR>History: <BR>SKP Securities Ltd started as a finance company and has since expanded its services beyond lending. The latest quarterly results reported net sales and net profit for the period ending March 2025.<BR><BR>Financial Snapshot: <BR>Net Sales: 8 Cr (Quarterly Results - Mar 2025) <BR>Net Profit: 1 Cr (Quarterly Results - Mar 2025) <BR>Market Cap: Rs 77 Cr (Micro Cap)<BR><BR>Key Metrics: <BR>P/E: 7.00 <BR>Industry P/E: 23 <BR>Dividend Yield: 1.38% <BR>Debt Equity: 0.20 <BR>Return on Equity: 19.70% <BR>Price to Book: 1.46<BR><BR>Contact Details: <BR>Address: BioWonder Level 17, 789 Anandapur EM Bypass Kolkata West Bengal : 700107 <BR>Tel: 91-33-40077000 <BR>Email: cs@skpmoneywise.com <BR>Website: http://www.skpmoneywise.com

View full answer

What is the bonus history of the SKP Securities?

06-Jun-2025

SKP Securities has a bonus history that includes a 1:1 bonus issue announced with an ex-date of June 16, 2022, and a record date of June 17, 2022, allowing shareholders to double their holdings.

SKP Securities has a bonus history that includes a notable event where they announced a 1:1 bonus issue. This was executed with an ex-date of June 16, 2022, and the record date was June 17, 2022. This means that for every share held, shareholders received an additional share, effectively doubling their holdings at that time. If you have any more questions about SKP Securities or need further details, feel free to ask!

View full answer

Has SKP Securities declared dividend?

06-Jun-2025

Yes, SKP Securities Ltd has declared a 15% dividend, amounting to 1.5 per share, with an ex-date of September 13, 2024. While recent total returns have been negative, longer-term returns indicate significant growth potential.

SKP Securities Ltd has declared a 15% dividend.<BR><BR>Dividend Details:<BR>- Percentage announced: 15%<BR>- Amount per share: 1.5<BR>- Ex-date: 13 Sep 24<BR><BR>Dividend Yield: 1.38%.<BR><BR>Total Returns by Period:<BR>In the last 6 months, the price return was -54.73%, with a dividend return of 0%, resulting in a total return of -54.73%.<BR><BR>Over the past year, the price return was -12.52%, the dividend return was 1.16%, leading to a total return of -11.36%.<BR><BR>In the 2-year period, the price return was 59.34%, the dividend return was 3.79%, culminating in a total return of 63.13%.<BR><BR>For the 3-year period, the price return was 91.4%, with a dividend return of 5.39%, resulting in a total return of 96.79%.<BR><BR>In the last 4 years, the price return was 254.63%, the dividend return was 6.90%, which produced a total return of 261.53%.<BR><BR>Over the last 5 years, the price return was 641.84%, with a dividend return of 10.42%, leading to a total return of 652.26%.<BR><BR>Overall, SKP Securities has declared a dividend, and while the recent total returns have been negative over shorter periods, longer-term returns show significant growth, indicating a potential recovery and value for investors.

View full answer

Who are the peers of the SKP Securities?

03-Jun-2025

SKP Securities' peers include Bajaj Finance, Jio Financial, Cholaman.Inv.&Fn, Shriram Finance, Muthoot Finance, Pioneer Invest, Banas Finance, Charter Capital, and Kapil Raj Financ. In terms of performance, Bajaj Finance leads with a 1-year return of 30.39%, while SKP Securities has a return of -10.61%.

Peers: The peers of SKP Securities are Bajaj Finance, Jio Financial, Cholaman.Inv.&Fn, Shriram Finance, Muthoot Finance, Pioneer Invest, Banas Finance, Charter. Capital, and Kapil Raj Financ.<BR><BR>Quality Snapshot: Excellent management risk is observed at Bajaj Finance, Cholaman.Inv.&Fn, Muthoot Finance, while Average management risk is found at Jio Financial, SKP Securities, Banas Finance, and the rest. Good growth is noted at Bajaj Finance, Cholaman.Inv.&Fn, Shriram Finance, SKP Securities, while Average growth is seen at Muthoot Finance, and Below Average growth is present at Pioneer Invest, Banas Finance, Charter. Capital, Kapil Raj Financ, and the rest. Excellent capital structure is held by Bajaj Finance, Jio Financial, Shriram Finance, Muthoot Finance, Pioneer Invest, SKP Securities, Banas Finance, Charter. Capital, and Kapil Raj Financ, while Good capital structure is found at Cholaman.Inv.&Fn.<BR><BR>Return Snapshot: The peer with the highest 1-year return is Bajaj Finance at 30.39%, while the lowest is Kapil Raj Financ at -75.77%. SKP Securities has a 1-year return of -10.61%, which is higher than Kapil Raj Financ but lower than all other peers. Additionally, the six-month return is negative for Jio Financial, Pioneer Invest, Banas Finance, Charter. Capital, and Kapil Raj Financ.

View full answer

What is the technical trend for SKP Securities?

09-Jun-2025

As of June 6, 2025, SKP Securities shows a mildly bearish technical trend, with mixed signals from indicators like the MACD and KST, while moving averages and Bollinger Bands remain bearish.

As of 6 June 2025, the technical trend for SKP Securities has changed from bearish to mildly bearish. The weekly MACD indicates a mildly bullish stance, while the monthly MACD is mildly bearish, suggesting mixed signals. The Bollinger Bands are bearish on both weekly and monthly time frames, and the daily moving averages remain bearish. The KST shows a mildly bullish trend weekly but is mildly bearish monthly. Dow Theory presents a mildly bearish outlook weekly and bullish monthly. Overall, the current technical stance is mildly bearish, driven primarily by the bearish moving averages and Bollinger Bands, despite some mildly bullish indicators in the MACD and KST.

View full answer

Who are in the management team of SKP Securities?

16-Jul-2025

As of March 2023, the management team of SKP Securities includes Naresh Pachisia (Managing Director), Nikunj Pachisia and Anil Shukla (Whole-time Directors), along with several Non-Executive Directors and a Company Secretary. They oversee the company's strategic direction and governance.

As of March 2023, the management team of SKP Securities includes the following members:<BR><BR>1. Naresh Pachisia - Managing Director<BR>2. Ravi Todi - Non-Executive & Independent Director<BR>3. Manju Pachisia - Non-Executive & Non-Independent Director<BR>4. Nikunj Pachisia - Whole-time Director<BR>5. Paritosh Sinha - Non-Executive & Independent Director<BR>6. Alka Khetawat - Company Secretary & Compliance Officer<BR>7. Santanu Ray - Non-Executive & Independent Director<BR>8. Anil Shukla - Whole Time Director & CFO<BR><BR>This team is responsible for the strategic direction and governance of the company.

View full answer

How big is SKP Securities?

24-Jul-2025

As of 24th July, SKP Securities Ltd has a market capitalization of 87.00 Cr and reported Net Sales of 11.18 Cr with a Net Profit loss of 0.33 Cr over the latest 4 quarters. The company has Shareholder's Funds of 21.55 Cr and Total Assets of 29.32 Cr.

As of 24th July, SKP Securities Ltd has a market capitalization of 87.00 Cr, categorized as a Micro Cap.<BR><BR>In the latest 4 quarters, the company reported Net Sales of 11.18 Cr. However, it experienced a Net Profit loss of 0.33 Cr during the same period.<BR><BR>The latest annual reporting period shows Shareholder's Funds of 21.55 Cr and Total Assets amounting to 29.32 Cr.

View full answer

Is SKP Securities overvalued or undervalued?

14-Nov-2025

As of November 13, 2025, SKP Securities is considered very attractive and undervalued in the NBFC sector, with a PE Ratio of 9.41 and an EV to EBITDA of 4.40, significantly lower than peers like Bajaj Finance and Life Insurance, despite a challenging year.

As of 13 November 2025, the valuation grade for SKP Securities has moved from attractive to very attractive, indicating a significant improvement in its perceived value. The company is currently considered undervalued, particularly when compared to its peers in the Non-Banking Financial Company (NBFC) sector. Key ratios supporting this assessment include a PE Ratio of 9.41, an EV to EBITDA of 4.40, and a PEG Ratio of 0.00, which suggests that the stock is trading at a low valuation relative to its earnings growth potential.<BR><BR>In comparison to peers, SKP Securities stands out with a much lower PE Ratio than Bajaj Finance at 34.18 and Life Insurance at 11.18, both of which are categorized as very expensive. Additionally, SKP's EV to EBITDA ratio of 4.40 is significantly lower than the industry average, further reinforcing its undervalued status. Despite a challenging year with a YTD return of -44.12% compared to the Sensex's 8.11%, the long-term performance of SKP Securities, with a 5-year return of 411.83%, highlights its potential for recovery and growth.

View full answer

How has been the historical performance of SKP Securities?

01-Dec-2025

SKP Securities has experienced a decline in key financial metrics from Mar'18 to Mar'20, with net sales dropping from 16.71 Cr to 11.10 Cr, and profit after tax turning from 5.10 Cr to a loss of 0.33 Cr. The company has struggled with profitability and revenue growth, particularly in the last two fiscal years.

Answer:<BR>The historical performance of SKP Securities shows a fluctuating trend in key financial metrics over the years.<BR><BR>Breakdown:<BR>Net sales for SKP Securities decreased from 16.71 Cr in Mar'18 to 11.10 Cr in Mar'20, with a slight drop from 11.25 Cr in Mar'19. Total operating income followed a similar trend, peaking at 16.71 Cr in Mar'18 and falling to 11.10 Cr by Mar'20. The company experienced a significant decline in operating profit, which dropped from 7.25 Cr in Mar'18 to just 0.74 Cr in Mar'20. Profit before tax also saw a downturn, moving from 6.75 Cr in Mar'18 to a loss of 0.02 Cr in Mar'20, while profit after tax fell from 5.10 Cr in Mar'18 to a loss of 0.33 Cr in Mar'20. The earnings per share (EPS) reflected this decline, dropping from 11.6 in Mar'18 to -0.08 in Mar'20. On the balance sheet, total assets decreased from 36.57 Cr in Mar'18 to 29.32 Cr in Mar'20, with total liabilities also declining from 36.57 Cr to 29.32 Cr in the same period. Cash flow from operating activities turned negative, showing -4.00 Cr in Mar'20 compared to positive figures in previous years. Overall, SKP Securities has faced challenges in maintaining profitability and revenue growth, particularly evident in the last two fiscal years.

View full answer

When is the next results date for SKP Securities Ltd?

23-Jan-2026

The next results date for SKP Securities Ltd is 28 January 2026.

The next results date for SKP Securities Ltd is scheduled for 28 January 2026.

View full answer

Are SKP Securities Ltd latest results good or bad?

29-Jan-2026

SKP Securities Ltd's latest results show a positive trend with a 16.52% increase in net sales and a 59.28% rise in net profit, indicating improvement. However, the company has a history of financial instability and a low score of 26 out of 100, suggesting ongoing concerns and caution for investors.

The latest results for SKP Securities Ltd show a mixed but generally positive trend. In the quarter ending December 2025, the company reported a 16.52% year-on-year increase in net sales, which is a positive sign compared to the previous year’s decline. Additionally, the standalone net profit saw a significant growth of 59.28%, a notable turnaround from the previous year's loss.<BR><BR>However, while these recent figures indicate improvement, the overall financial health of the company has been concerning in the past. The company has faced substantial challenges, including a dramatic decline in profitability over the years, with profit margins collapsing from 31.2% in FY2018 to 0.0% in FY2020. This history of volatility raises questions about the sustainability of the recent gains.<BR><BR>Moreover, the company has a low score of 26 out of 100, categorized as a "Strong Sell," indicating ongoing concerns about its operational challenges and market perception. The absence of institutional interest and significant underperformance relative to the market further complicates the outlook.<BR><BR>In summary, while the latest results show positive growth trends, the company still faces significant hurdles that could affect its long-term viability. Investors should approach with caution, considering both the recent improvements and the historical context of financial instability.

View full answer

Should I buy, sell or hold SKP Securities Ltd?

05-Feb-2026

Why is SKP Securities Ltd falling/rising?

13-Feb-2026

As of 13-Feb, SKP Securities Ltd's stock price is at Rs 97.00, reflecting a significant decline of 38.57% over the past year. The stock is underperforming with decreased investor participation and is trading below all major moving averages, indicating a bearish trend.

As of 13-Feb, SKP Securities Ltd's stock price is falling, currently at Rs 97.00, which represents a decrease of Rs 2.1 or 2.12%. The stock has been underperforming significantly, with a decline of 8.53% over the past week and 9.64% over the past month. Year-to-date, the stock has dropped 16.38%, while it has seen a substantial decline of 38.57% over the past year, contrasting sharply with the Sensex, which has gained 8.52% in the same period.<BR><BR>Today, the stock has experienced a consecutive fall for the last three days, resulting in a total decline of 6.78% during this timeframe. The stock reached an intraday high of Rs 104.8 but fell to its current low of Rs 97, indicating significant volatility. Additionally, the stock is trading below its 5-day, 20-day, 50-day, 100-day, and 200-day moving averages, which typically signals a bearish trend.<BR><BR>Investor participation has also decreased, with delivery volume dropping by 80.78% compared to the 5-day average, suggesting a lack of confidence among investors. Overall, these factors contribute to the ongoing decline in SKP Securities Ltd's stock price.

View full answer
iScoreScore
Click here to find our call on this stock
Strong Sell
Sell
Hold
Buy
Strong Buy

Dashboard

1

Flat results in Dec 25

 
2

Below par performance in long term as well as near term

stock-summaryMojo Parameters

Mojo Parameters

Loading Valuation Snapshot...

Stock DNA

stock-summary
Industry

Non Banking Financial Company (NBFC)

stock-summary
Market cap

INR 68 Cr (Micro Cap)

stock-summary
P/E

7.00

stock-summary
Industry P/E

23

stock-summary
Dividend Yield

2.02%

stock-summary
Debt Equity

0.35

stock-summary
Return on Equity

17.43%

stock-summary
Price to Book

1.22

Revenue and Profits:
Net Sales:
10 Cr
(Quarterly Results - Dec 2025)
Net Profit:
3 Cr
stock-summaryTotal Returns
Total Returns (Price + Dividend) stock-summary
Dividend Yield (2.02%)
TimePeriod
Price Return
Dividend Return
Total Return
3 Months
-18.49%
0%
-18.49%
6 Months
-22.4%
1.64%
-20.76%
1 Year
-38.57%
1.37%
-37.2%
2 Years
4.36%
3.43%
7.79%
3 Years
29.33%
6.57%
35.9%
4 Years
147.92%
11.51%
159.43%
5 Years
220.13%
18.22%
238.35%

Latest dividend: 2 per share ex-dividend date: Aug-29-2025

Risk Adjusted Returns v/s stock-summary
Returns Beta
Icon
Beta has not been calculated since enough price history is not available
stock-summaryNews & Corporate Actions

News

Why is SKP Securities Ltd falling/rising?

Recent Price Movement and Market Comparison

SKP Securities has been under pressure over multiple time frames. In the past week, the stock declined by 1.78%, contrasting with the Sensex’s modest gain of 0.50%. Over the last month, the divergence widened further, with SKP Securities falling 8.77% while the Sensex advanced by 0.79%. Year-to-date figures reveal a sharper decline of 14.35% for the stock, compared to a relatively mild 1.16% drop in the benchmark index. The one-year performance is particularly stark, with SKP Securities down 34.77%, whereas the Sensex has risen by 10.41% during the same period. Although the stock has delivered strong returns over five years, outperforming the Sensex by a wide margin (231.72% versus 63.46%), its recent trajectory signals growing chal...

Read full news article
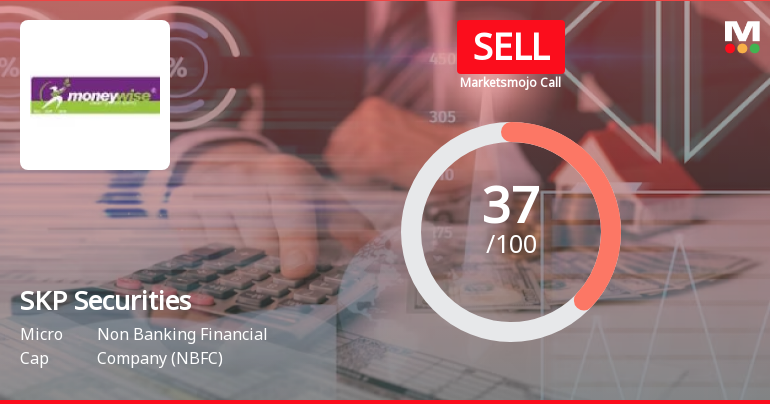
Announcements stock-summary

Board Meeting Outcome for Outcome Of Board Meeting

28-Jan-2026 | Source : BSE

Outcome of Board Meeting

Unaudited Financial Results Of The Company For The Quarter And Nine Months Ended December 31 2025

28-Jan-2026 | Source : BSE

Unaudited Financial Results of the Company for the quarter and nine months ended December 31 2025

Board Meeting Intimation for Considering And Approving The Un-Audited Financial Results Of The Company For The Quarter And Nine Months Ended December 31 2025.

22-Jan-2026 | Source : BSE

SKP Securities Ltdhas informed BSE that the meeting of the Board of Directors of the Company is scheduled on 28/01/2026 inter alia to consider and approve the Un-audited Financial Results of the Company for the quarter and nine months ended December 31 2025.

Corporate Actions stock-summary

stock-summary
BOARD MEETING

No Upcoming Board Meetings

stock-summary
DIVIDEND

SKP Securities Ltd has declared 20% dividend, ex-date: 29 Aug 25

stock-summary
SPLITS

No Splits history available

stock-summary
BONUS

SKP Securities Ltd has announced 1:1 bonus issue, ex-date: 16 Jun 22

stock-summary
RIGHTS

No Rights history available

stock-summaryKey Factors

Quality key factors stock-summary

Factor
Value
Sales Growth (5y)
22.71%
EBIT Growth (5y)
39.00%
Net Debt to Equity (avg)
0.35
Institutional Holding
0.28%
ROE (avg)
17.20%

Valuation key factors

Factor
Value
P/E Ratio
7
Industry P/E
23
Price to Book Value
1.20
EV to EBIT
3.04
EV to EBITDA
2.93
EV to Capital Employed
1.35
EV to Sales
1.06
PEG Ratio
NA
Dividend Yield
2.06%
ROCE (Latest)
39.76%
ROE (Latest)
17.43%

Technicals key factors

Indicator
Weekly
Monthly
MACD
Bearish
Bearish
RSI
No Signal
Bullish
Bollinger Bands
Bearish
Bearish
Moving Averages
Bearish (Daily)
KST
Bearish
Bearish
Dow Theory
Mildly Bullish
Mildly Bearish
stock-summary Technical Indicator Scale: Bearish, Mildly Bearish, Sideways, Mildly Bullish, Bullish  Turned 
stock-summaryShareholding
Shareholding Snapshot : Dec 2025stock-summary
Shareholding Compare (%holding) stock-summary
Majority shareholders

Promoters

Pledged Promoter Holdings

None

Mutual Funds

Held by 0 Schemes

FIIs

Held by 0 FIIs

Promoter with highest holding

Naresh Pachisia (26.23%)

Highest Public shareholder

Vinita Bangur (6.82%)

Individual Investors Holdings

22.02%

stock-summaryFinancial
[
  {
    "link": "quarterly",
    "btn_text": "All Quarterly Results",
    "header": "Quarterly Results Snapshot (Standalone) - Dec'25 - YoY",
    "rhs": [
      {
        "prefix": "Net Sales ",
        "suffix": "YoY Growth in quarter ended Dec 2025 is 16.52% vs -0.89% in Dec 2024",
        "dir": 1
      },
      {
        "prefix": "Standalone Net Profit ",
        "suffix": "YoY Growth in quarter ended Dec 2025 is 59.28% vs -44.33% in Dec 2024",
        "dir": 1
      }
    ],
    "table": {
      "header": [
        "Dec'25",
        "Dec'24",
        "Change(%)"
      ],
      "body": [
        {
          "field": "Net Sales",
          "val1": "10.37",
          "val2": "8.90",
          "chgp": "16.52%",
          "chgp_class": "positive"
        },
        {
          "field": "Operating Profit (PBDIT) excl Other Income",
          "val1": "4.12",
          "val2": "2.67",
          "chgp": "54.31%",
          "chgp_class": "positive"
        },
        {
          "field": "Interest",
          "val1": "0.43",
          "val2": "0.29",
          "chgp": "48.28%",
          "chgp_class": "negative"
        },
        {
          "field": "Exceptional Items",
          "val1": "0.00",
          "val2": "0.00",
          "chgp": "",
          "chgp_class": "neutral"
        },
        {
          "field": "Standalone Net Profit",
          "val1": "2.66",
          "val2": "1.67",
          "chgp": "59.28%",
          "chgp_class": "positive"
        },
        {
          "field": "Operating Profit Margin (Excl OI)",
          "val1": "39.73%",
          "val2": "30.00%",
          "chgp": "9.73%",
          "chgp_class": "positive"
        }
      ]
    }
  },
  {
    "link": "half-yearly",
    "btn_text": "All Half Yearly Results",
    "header": "Half Yearly Results Snapshot (Standalone) - Sep'25",
    "rhs": [
      {
        "prefix": "Net Sales ",
        "suffix": " Growth in half year ended Sep 2025 is 0.62% vs 64.61% in Sep 2024",
        "dir": -1
      },
      {
        "prefix": "Standalone Net Profit ",
        "suffix": " Growth in half year ended Sep 2025 is -19.27% vs 155.71% in Sep 2024",
        "dir": -1
      }
    ],
    "table": {
      "header": [
        "Sep'25",
        "Sep'24",
        "Change(%)"
      ],
      "body": [
        {
          "field": "Net Sales",
          "val1": "21.25",
          "val2": "21.12",
          "chgp": "0.62%",
          "chgp_class": "positive"
        },
        {
          "field": "Operating Profit (PBDIT) excl Other Income",
          "val1": "7.82",
          "val2": "9.69",
          "chgp": "-19.30%",
          "chgp_class": "negative"
        },
        {
          "field": "Interest",
          "val1": "0.62",
          "val2": "0.32",
          "chgp": "93.75%",
          "chgp_class": "negative"
        },
        {
          "field": "Exceptional Items",
          "val1": "0.00",
          "val2": "0.00",
          "chgp": "",
          "chgp_class": "neutral"
        },
        {
          "field": "Standalone Net Profit",
          "val1": "5.78",
          "val2": "7.16",
          "chgp": "-19.27%",
          "chgp_class": "negative"
        },
        {
          "field": "Operating Profit Margin (Excl OI)",
          "val1": "36.80%",
          "val2": "45.88%",
          "chgp": "-9.08%",
          "chgp_class": "negative"
        }
      ]
    }
  },
  {
    "link": "nine-monthly",
    "btn_text": "All Nine Monthly Results",
    "header": "Nine Monthly Results Snapshot (Standalone) - Dec'25",
    "rhs": [
      {
        "prefix": "Net Sales ",
        "suffix": "YoY Growth in nine months ended Dec 2025 is 5.33% vs 37.64% in Dec 2024",
        "dir": -1
      },
      {
        "prefix": "Standalone Net Profit ",
        "suffix": "YoY Growth in nine months ended Dec 2025 is -4.42% vs 52.24% in Dec 2024",
        "dir": -1
      }
    ],
    "table": {
      "header": [
        "Dec'25",
        "Dec'24",
        "Change(%)"
      ],
      "body": [
        {
          "field": "Net Sales",
          "val1": "31.62",
          "val2": "30.02",
          "chgp": "5.33%",
          "chgp_class": "positive"
        },
        {
          "field": "Operating Profit (PBDIT) excl Other Income",
          "val1": "11.94",
          "val2": "12.36",
          "chgp": "-3.40%",
          "chgp_class": "negative"
        },
        {
          "field": "Interest",
          "val1": "1.05",
          "val2": "0.61",
          "chgp": "72.13%",
          "chgp_class": "negative"
        },
        {
          "field": "Exceptional Items",
          "val1": "0.00",
          "val2": "0.00",
          "chgp": "",
          "chgp_class": "neutral"
        },
        {
          "field": "Standalone Net Profit",
          "val1": "8.44",
          "val2": "8.83",
          "chgp": "-4.42%",
          "chgp_class": "negative"
        },
        {
          "field": "Operating Profit Margin (Excl OI)",
          "val1": "37.76%",
          "val2": "41.17%",
          "chgp": "-3.41%",
          "chgp_class": "negative"
        }
      ]
    }
  },
  {
    "link": "annual",
    "btn_text": "All Annual Results",
    "header": "Annual Results Snapshot (Consolidated) - Mar'25",
    "rhs": [
      {
        "prefix": "Net Sales ",
        "suffix": "YoY Growth in year ended Mar 2025 is 29.43% vs 23.87% in Mar 2024",
        "dir": 1
      },
      {
        "prefix": "Consolidated Net Profit ",
        "suffix": "YoY Growth in year ended Mar 2025 is 15.49% vs 179.03% in Mar 2024",
        "dir": -1
      }
    ],
    "table": {
      "header": [
        "Mar'25",
        "Mar'24",
        "Change(%)"
      ],
      "body": [
        {
          "field": "Net Sales",
          "val1": "36.33",
          "val2": "28.07",
          "chgp": "29.43%",
          "chgp_class": "positive"
        },
        {
          "field": "Operating Profit (PBDIT) excl Other Income",
          "val1": "14.72",
          "val2": "12.37",
          "chgp": "19.00%",
          "chgp_class": "positive"
        },
        {
          "field": "Interest",
          "val1": "0.84",
          "val2": "0.31",
          "chgp": "170.97%",
          "chgp_class": "negative"
        },
        {
          "field": "Exceptional Items",
          "val1": "0.05",
          "val2": "0.00",
          "chgp": "",
          "chgp_class": "neutral"
        },
        {
          "field": "Consolidate Net Profit",
          "val1": "9.99",
          "val2": "8.65",
          "chgp": "15.49%",
          "chgp_class": "positive"
        },
        {
          "field": "Operating Profit Margin (Excl OI)",
          "val1": "39.09%",
          "val2": "42.24%",
          "chgp": "-3.15%",
          "chgp_class": "negative"
        }
      ]
    }
  }
]

Quarterly Results Snapshot (Standalone) - Dec'25 - YoYstock-summary

Dec'25
Dec'24
Change(%)
Net Sales
10.37
8.90
16.52%
Operating Profit (PBDIT) excl Other Income
4.12
2.67
54.31%
Interest
0.43
0.29
48.28%
Exceptional Items
0.00
0.00
Standalone Net Profit
2.66
1.67
59.28%
Operating Profit Margin (Excl OI)
39.73%
30.00%
9.73%
Values in Rs Cr.
Direction Arrows
Net Sales

YoY Growth in quarter ended Dec 2025 is 16.52% vs -0.89% in Dec 2024

Direction Arrows
Standalone Net Profit

YoY Growth in quarter ended Dec 2025 is 59.28% vs -44.33% in Dec 2024

Half Yearly Results Snapshot (Standalone) - Sep'25stock-summary

Sep'25
Sep'24
Change(%)
Net Sales
21.25
21.12
0.62%
Operating Profit (PBDIT) excl Other Income
7.82
9.69
-19.30%
Interest
0.62
0.32
93.75%
Exceptional Items
0.00
0.00
Standalone Net Profit
5.78
7.16
-19.27%
Operating Profit Margin (Excl OI)
36.80%
45.88%
-9.08%
Values in Rs Cr.
Direction Arrows
Net Sales

Growth in half year ended Sep 2025 is 0.62% vs 64.61% in Sep 2024

Direction Arrows
Standalone Net Profit

Growth in half year ended Sep 2025 is -19.27% vs 155.71% in Sep 2024

Nine Monthly Results Snapshot (Standalone) - Dec'25stock-summary

Dec'25
Dec'24
Change(%)
Net Sales
31.62
30.02
5.33%
Operating Profit (PBDIT) excl Other Income
11.94
12.36
-3.40%
Interest
1.05
0.61
72.13%
Exceptional Items
0.00
0.00
Standalone Net Profit
8.44
8.83
-4.42%
Operating Profit Margin (Excl OI)
37.76%
41.17%
-3.41%
Values in Rs Cr.
Direction Arrows
Net Sales

YoY Growth in nine months ended Dec 2025 is 5.33% vs 37.64% in Dec 2024

Direction Arrows
Standalone Net Profit

YoY Growth in nine months ended Dec 2025 is -4.42% vs 52.24% in Dec 2024

Annual Results Snapshot (Consolidated) - Mar'25stock-summary

Mar'25
Mar'24
Change(%)
Net Sales
36.33
28.07
29.43%
Operating Profit (PBDIT) excl Other Income
14.72
12.37
19.00%
Interest
0.84
0.31
170.97%
Exceptional Items
0.05
0.00
Consolidate Net Profit
9.99
8.65
15.49%
Operating Profit Margin (Excl OI)
39.09%
42.24%
-3.15%
Values in Rs Cr.
Direction Arrows
Net Sales

YoY Growth in year ended Mar 2025 is 29.43% vs 23.87% in Mar 2024

Direction Arrows
Consolidated Net Profit

YoY Growth in year ended Mar 2025 is 15.49% vs 179.03% in Mar 2024

stock-summaryCompany CV
About SKP Securities Ltd stock-summary
stock-summary
SKP Securities Ltd
Micro Cap
Non Banking Financial Company (NBFC)
Started as an Finance Company, SKP Securities Limited has widen its services in other financial activities other than lending of money. Company is primarily engaged in stock broking and depository participant services, distribution of financial products, investment/ merchant banking and corporate advisory services, serving a cross section of society viz. financial institutions, corporates, business families, professionals and retail investors.
Company Coordinates stock-summary
Company Details
BioWonder Level 17, 789 Anandapur EM Bypass Kolkata West Bengal : 700107
stock-summary
Tel: 91-33-40077000
stock-summary
cs@skpmoneywise.com
Registrar Details
Maheshwari Datamatics Pvt Ltd , 6 Mangoe Lane , 2nd Floor, Calcutta