
Compare SMS Pharma. with Similar Stocks
Dashboard
Weak Long Term Fundamental Strength with an average Return on Capital Employed (ROCE) of 9.88%
- Poor long term growth as Net Sales has grown by an annual rate of 9.51% and Operating profit at 5.95% over the last 5 years
With ROCE of 11.9, it has a Expensive valuation with a 3.5 Enterprise value to Capital Employed
Stock DNA
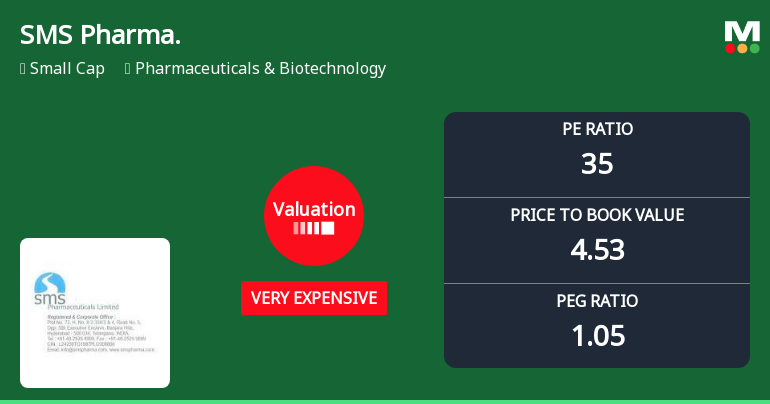
Pharmaceuticals & Biotechnology
INR 3,513 Cr (Small Cap)
34.00
35
0.10%
0.41
12.98%
4.51
Total Returns (Price + Dividend) 
Latest dividend: 0.40120375287661536 per share ex-dividend date: Sep-22-2025
Risk Adjusted Returns v/s
Returns Beta

News
SMS Pharmaceuticals Ltd Valuation Shifts Signal Heightened Price Premium
SMS Pharmaceuticals Ltd has seen a notable shift in its valuation parameters, moving from an expensive to a very expensive rating, despite delivering robust returns well above the Sensex over multiple time horizons. This article analyses the recent changes in key valuation metrics such as the price-to-earnings (P/E) and price-to-book value (P/BV) ratios, compares them with peer averages, and assesses the implications for investors amid evolving market conditions.
Read full news article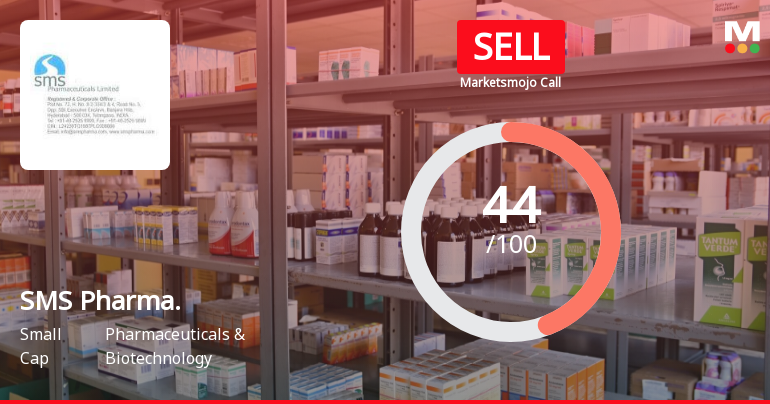
SMS Pharmaceuticals Ltd is Rated Sell
SMS Pharmaceuticals Ltd is rated 'Sell' by MarketsMOJO. This rating was last updated on 25 May 2026. However, the analysis and financial metrics presented here reflect the stock's current position as of 18 June 2026, providing investors with the most recent and relevant data to assess the company’s outlook.
Read full news article
SMS Pharmaceuticals Ltd Valuation Shifts Signal Heightened Price Risk Amid Strong Returns
SMS Pharmaceuticals Ltd has seen a marked shift in its valuation parameters, moving from an expensive to a very expensive rating, despite delivering robust returns that have significantly outpaced the Sensex over multiple time horizons. This article analyses the recent changes in key valuation metrics, compares them with peer averages, and assesses the implications for investors in the Pharmaceuticals & Biotechnology sector.
Read full news article Announcements
Disclosure Under Regulation 30 Of The SEBI (LODR) Regulations 2015.
05-Jun-2026 | Source : BSEPlease find the annexure
Announcement under Regulation 30 (LODR)-Earnings Call Transcript
30-May-2026 | Source : BSETranscripts of the Conference call held on 27th May 2026
Announcement under Regulation 30 (LODR)-Analyst / Investor Meet - Outcome
27-May-2026 | Source : BSEAudio recording of Analysts/Investors Conference Call pertaining to the Financial Results for the fourth quarter and year ended 31st March 2026
Corporate Actions

No Upcoming Board Meetings

SMS Pharmaceuticals Ltd has declared 40% dividend, ex-date: 22 Sep 25

SMS Pharmaceuticals Ltd has announced 1:10 stock split, ex-date: 17 Dec 15

No Bonus history available

No Rights history available
Quality key factors
Valuation key factors
Technicals key factors
 Technical Indicator Scale: Bearish, Mildly Bearish, Sideways, Mildly Bullish, Bullish Turned
 Shareholding Snapshot : Mar 2026
Shareholding Compare (%holding)
Promoters
17.9885
Held by 3 Schemes (2.96%)
Held by 15 FIIs (0.31%)
Ramesh Babu Potluri (19.38%)
Quant Mutual Fund - Quant Small Cap Fund (3.21%)
23.17%
Quarterly Results Snapshot (Consolidated) - Mar'26 - QoQ

QoQ Growth in quarter ended Mar 2026 is 13.07% vs -13.19% in Dec 2025
QoQ Growth in quarter ended Mar 2026 is 39.37% vs -7.27% in Dec 2025
Half Yearly Results Snapshot (Consolidated) - Sep'25
Growth in half year ended Sep 2025 is 21.40% vs 19.61% in Sep 2024
Growth in half year ended Sep 2025 is 49.77% vs 45.14% in Sep 2024
Nine Monthly Results Snapshot (Consolidated) - Dec'25
YoY Growth in nine months ended Dec 2025 is 21.40% vs 15.34% in Dec 2024

YoY Growth in nine months ended Dec 2025 is 41.89% vs 49.98% in Dec 2024
Annual Results Snapshot (Consolidated) - Mar'26
YoY Growth in year ended Mar 2026 is 13.30% vs 10.36% in Mar 2025
YoY Growth in year ended Mar 2026 is 47.51% vs 38.75% in Mar 2025
About SMS Pharmaceuticals Ltd

Company Coordinates


