
Compare SMT Engineering with Similar Stocks
Dashboard
Poor Management Efficiency with a low ROCE of 4.72%
- The company has been able to generate a Return on Capital Employed (avg) of 4.72% signifying low profitability per unit of total capital (equity and debt)
Low ability to service debt as the company has a high Debt to EBITDA ratio of 2.03 times
Healthy long term growth as Net Sales has grown by an annual rate of 176.73% and Operating profit at 109.91%
With a growth in Net Profit of 419.83%, the company declared Outstanding results in Mar 26
With ROCE of 20.6, it has a Very Expensive valuation with a 4.3 Enterprise value to Capital Employed
Stock DNA
Trading & Distributors
INR 688 Cr (Micro Cap)
33.00
21
0.00%
0.59
19.15%
6.01
Total Returns (Price + Dividend) 
SMT Engineering for the last several years.
Risk Adjusted Returns v/s
Returns Beta

News

SMT Engineering Ltd is Rated Hold by MarketsMOJO
SMT Engineering Ltd is rated 'Hold' by MarketsMOJO, with this rating last updated on 01 June 2026. While the rating change occurred on that date, the analysis and financial metrics discussed here reflect the company’s current position as of 04 June 2026, providing investors with an up-to-date view of the stock’s fundamentals, valuation, financial trends, and technical outlook.
Read full news article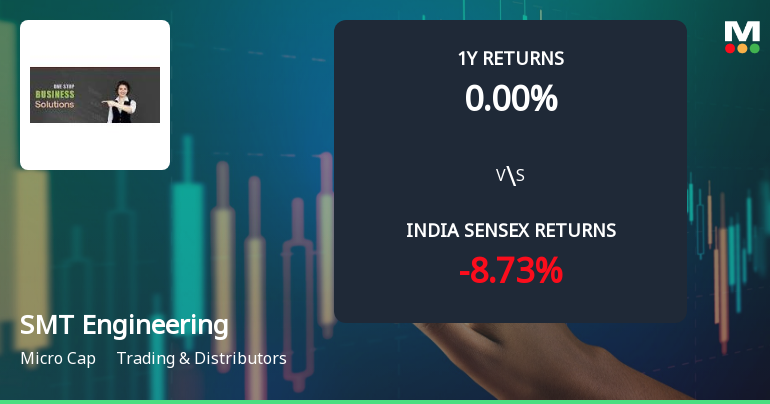
SMT Engineering Ltd Sees Technical Momentum Shift Amid Mixed Indicator Signals
SMT Engineering Ltd, a micro-cap player in the Trading & Distributors sector, has recently exhibited a notable shift in its technical momentum, moving from a sideways trend to a mildly bullish stance. This change is underscored by improvements in key technical indicators and a significant price uptick, signalling potential opportunities for investors amid a mixed market backdrop.
Read full news article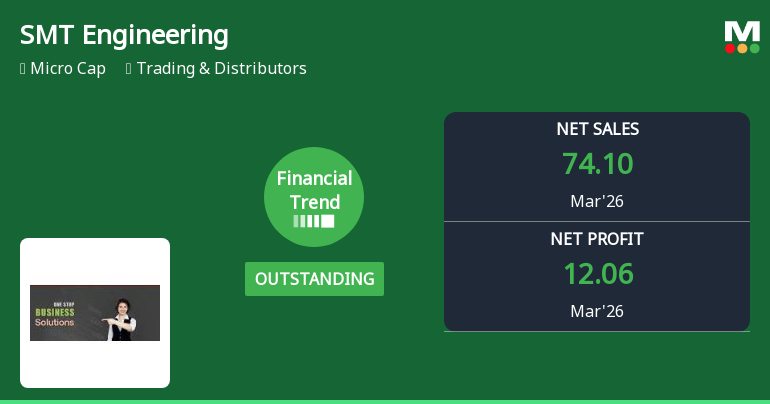
SMT Engineering Ltd Reports Outstanding Quarterly Performance Amid Financial Trend Upgrade
SMT Engineering Ltd has delivered an exceptional quarterly performance for the period ending March 2026, prompting a significant upgrade in its financial trend rating from positive to outstanding. The company’s latest results showcase record-breaking revenue and profit metrics, signalling a robust turnaround in operational efficiency and market positioning within the Trading & Distributors sector.
Read full news article Announcements
Announcement under Regulation 30 (LODR)-Newspaper Publication
30-May-2026 | Source : BSESubmission of Newspaper Publication of Audited Standalone and Consolidated Financial Results for the Quarter and Year Ended March 31 2026
Announcement under Regulation 30 (LODR)-Change in Management
29-May-2026 | Source : BSESubmission on Re-Appointment of Internal Auditor of the Company for the FY 2026-27.
Board Comments On Fine Levied By BSE Limited For Non-Compliance With The Requirement To Disclose Related Party Transaction
29-May-2026 | Source : BSESubmission of Board Comments on Fine levied by BSE on delay in filing of related party transactions under SEBI (LODR) Regulations 2015
Corporate Actions

No Upcoming Board Meetings

No Dividend history available

No Splits history available

No Bonus history available

No Rights history available
Quality key factors
Valuation key factors
Technicals key factors
 Technical Indicator Scale: Bearish, Mildly Bearish, Sideways, Mildly Bullish, Bullish Turned
 Shareholding Snapshot : Mar 2026
Shareholding Compare (%holding)
Promoters
None
Held by 0 Schemes
Held by 0 FIIs
Ajay Jaiswal (19.93%)
Jitendra Rasiklal Sanghavi (2.77%)
31.7%
Quarterly Results Snapshot (Consolidated) - Mar'26 - QoQ

QoQ Growth in quarter ended Mar 2026 is 175.67% vs -21.24% in Dec 2025
QoQ Growth in quarter ended Mar 2026 is 419.83% vs -63.46% in Dec 2025
Half Yearly Results Snapshot (Consolidated) - Sep'25
Growth in half year ended Sep 2025 is 10,647.37% vs 5,600.00% in Sep 2024
Growth in half year ended Sep 2025 is 3,380.00% vs -90.27% in Sep 2024
Nine Monthly Results Snapshot (Consolidated) - Dec'25

YoY Growth in nine months ended Dec 2025 is 9,276.60% vs 9,300.00% in Dec 2024
YoY Growth in nine months ended Dec 2025 is 3,700.00% vs -90.24% in Dec 2024
Annual Results Snapshot (Consolidated) - Mar'26
YoY Growth in year ended Mar 2026 is 671.84% vs 721.09% in Mar 2025
YoY Growth in year ended Mar 2026 is 834.41% vs 247.02% in Mar 2025
About SMT Engineering Ltd

Company Coordinates


