
Compare Snowman Logistic with Similar Stocks
Dashboard
Weak Long Term Fundamental Strength with an average Return on Capital Employed (ROCE) of 4.25%
- Poor long term growth as Operating profit has grown by an annual rate 7.77% of over the last 5 years
- Low ability to service debt as the company has a high Debt to EBITDA ratio of 3.70 times
Despite the size of the company, domestic mutual funds hold only 0% of the company
Below par performance in long term as well as near term
Stock DNA
Transport Services
INR 618 Cr (Micro Cap)
103.00
40
1.34%
0.79
1.49%
1.53
Total Returns (Price + Dividend) 
Latest dividend: 0.49667736021998166 per share ex-dividend date: Feb-12-2026
Risk Adjusted Returns v/s
Returns Beta

News

Snowman Logistics Ltd is Rated Sell
Snowman Logistics Ltd is rated 'Sell' by MarketsMOJO, with this rating last updated on 01 June 2026. However, the analysis and financial metrics discussed here reflect the stock's current position as of 16 July 2026, providing investors with the most up-to-date view of the company’s performance and outlook.
Read full news article
Snowman Logistics Ltd Faces Bearish Momentum Amid Technical Downturn
Snowman Logistics Ltd, a micro-cap player in the transport services sector, has experienced a notable shift in its technical momentum, moving from a mildly bearish stance to a more pronounced bearish trend. This transition is underscored by mixed signals from key technical indicators such as MACD, RSI, Bollinger Bands, and moving averages, reflecting growing investor caution amid a challenging market backdrop.
Read full news article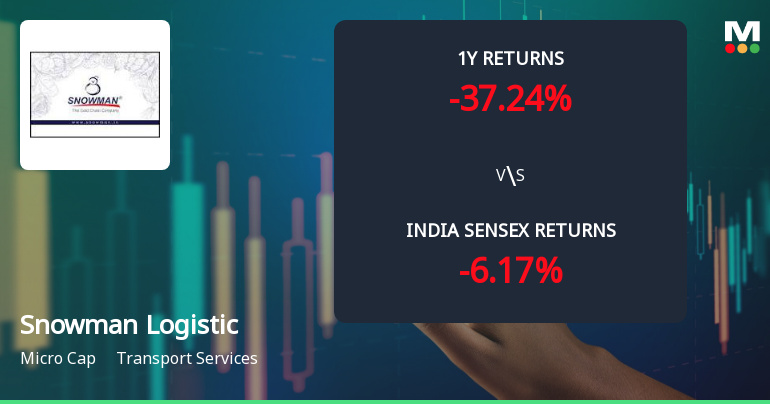
Snowman Logistics Ltd Technical Momentum Shifts Amid Mixed Market Signals
Snowman Logistics Ltd, a micro-cap player in the transport services sector, has exhibited a nuanced shift in its technical momentum, moving from a strongly bearish stance to a mildly bearish outlook. Despite a marginal day change of -0.05%, the stock’s technical indicators reveal a complex interplay of bullish and bearish signals, underscoring the challenges faced by investors in navigating its price trajectory.
Read full news article Announcements
Snowman Logistics Limited - Press Release
18-Nov-2019 | Source : NSESnowman Logistics Limited has informed the Exchange regarding a press release dated November 14, 2019, titled "Publication of Unaudited Financial Results for the Quarter & half year ended
Snowman Logistics Limited - Outcome of Board Meeting
14-Nov-2019 | Source : NSESnowman Logistics Limited has informed the Exchange regarding Board meeting held on November 13, 2019.
Shareholders meeting
14-Aug-2019 | Source : NSE
| Snowman Logistics Limited has submitted the Exchange a copy Srutinizers report of Annual General Meeting held on August 13, 2019. Further, the company has informed the Exchange regarding voting results. |
Corporate Actions

No Upcoming Board Meetings

Snowman Logistics Ltd has declared 5% dividend, ex-date: 12 Feb 26

No Splits history available

No Bonus history available

No Rights history available
Quality key factors
Valuation key factors
Technicals key factors
 Technical Indicator Scale: Bearish, Mildly Bearish, Sideways, Mildly Bullish, Bullish Turned
 Shareholding Snapshot : Jun 2026
Shareholding Compare (%holding)
Promoters
None
Held by 0 Schemes
Held by 13 FIIs (2.96%)
Gateway Distriparks Limited (50.01%)
Vijaya S (2.49%)
39.0%
Quarterly Results Snapshot (Standalone) - Mar'26 - YoY

YoY Growth in quarter ended Mar 2026 is 3.87% vs 8.27% in Mar 2025
YoY Growth in quarter ended Mar 2026 is 42.05% vs 81.40% in Mar 2025
Half Yearly Results Snapshot (Standalone) - Sep'25

Growth in half year ended Sep 2025 is 12.23% vs 12.22% in Sep 2024
Growth in half year ended Sep 2025 is -115.42% vs -61.97% in Sep 2024
Nine Monthly Results Snapshot (Standalone) - Dec'25
YoY Growth in nine months ended Dec 2025 is 11.20% vs 10.26% in Dec 2024
YoY Growth in nine months ended Dec 2025 is -225.14% vs -83.05% in Dec 2024
Annual Results Snapshot (Standalone) - Mar'26
YoY Growth in year ended Mar 2026 is 9.38% vs 9.77% in Mar 2025
YoY Growth in year ended Mar 2026 is -42.00% vs -55.23% in Mar 2025
About Snowman Logistics Ltd

Company Coordinates


