
Compare Softtech Enginee with Similar Stocks
Dashboard
Poor Management Efficiency with a low ROE of 3.27%
- The company has been able to generate a Return on Equity (avg) of 3.27% signifying low profitability per unit of shareholders funds
Strong ability to service debt as the company has a low Debt to EBITDA ratio of 1.21 times
Poor long term growth as Operating profit has grown by an annual rate 4.97% of over the last 5 years
With a growth in Net Profit of 4433.33%, the company declared Outstanding results in Mar 26
With ROE of 2.9, it has a Very Expensive valuation with a 3.3 Price to Book Value
Despite the size of the company, domestic mutual funds hold only 0% of the company
Stock DNA
Computers - Software & Consulting
INR 574 Cr (Micro Cap)
113.00
20
0.00%
0.02
2.88%
3.26
Total Returns (Price + Dividend) 
Softtech Enginee for the last several years.
Risk Adjusted Returns v/s
Returns Beta

News
Softtech Engineers Ltd Technical Momentum Shifts Amid Mixed Indicator Signals
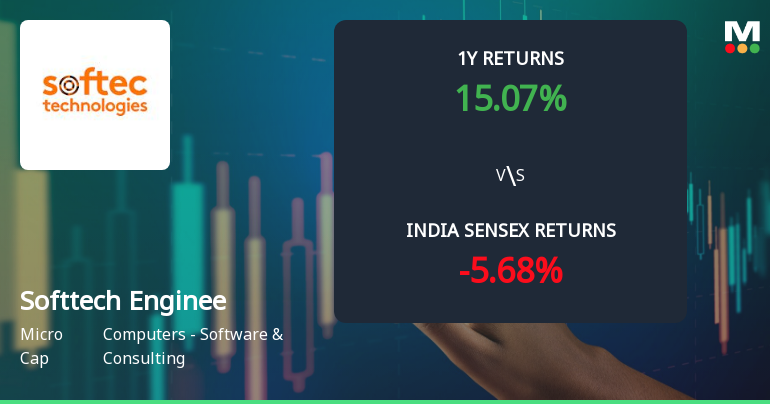
Softtech Engineers Ltd, a micro-cap player in the Computers - Software & Consulting sector, has experienced a nuanced shift in its technical momentum, reflecting a complex interplay of bullish and bearish signals across key indicators. Despite a recent downgrade from a Buy to a Hold rating by MarketsMOJO on 6 July 2026, the stock’s year-to-date return of 8.28% notably outperforms the Sensex’s negative 9.84% over the same period, underscoring resilience amid broader market weakness.
Read full news article
Softtech Engineers Ltd is Rated Hold
Softtech Engineers Ltd is rated 'Hold' by MarketsMOJO, with this rating last updated on 06 July 2026. However, the analysis and financial metrics discussed here reflect the company’s current position as of 22 July 2026, providing investors with the latest insights into the stock’s performance and outlook.
Read full news article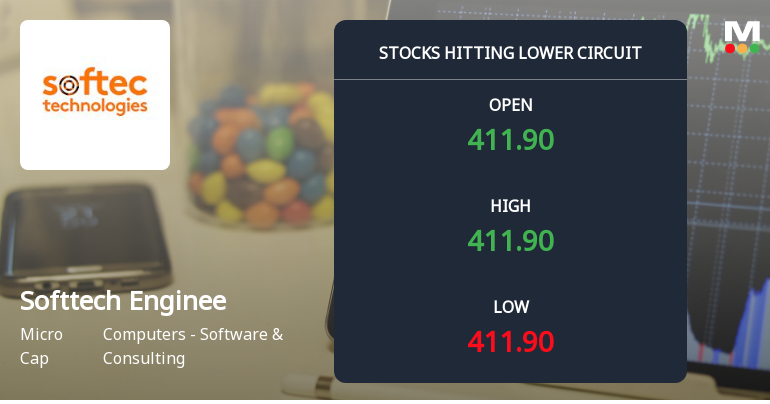
Softtech Engineers Ltd Locks at Lower Circuit With 5.0% Loss — Sellers Queue, No Buyers in Sight
At Rs 412.30, sellers were still queuing — but there were no buyers willing to take the other side. Softtech Engineers Ltd locked at its lower circuit of 5.0% on 13 Jul 2026, with unfilled sell orders and a frozen price.
Read full news article Announcements
Submission Of Certificate Under Regulation 76 Of SEBI (DP) Regulations 2018
16-Jul-2026 | Source : BSESubmission of Certificate under Regulation 76 of SEBI DP Regulations 2018 for quarter ended June 30 2026
Compliances-Certificate under Reg. 74 (5) of SEBI (DP) Regulations 2018
10-Jul-2026 | Source : BSECertificate under Regulation 74(5) under SEBI DP Regulations 2018 for the quarter ended June 30 2026.
Closure of Trading Window
24-Jun-2026 | Source : BSETrading window closure for quarter ended June 30 2026
Corporate Actions

No Upcoming Board Meetings

Softtech Engineers Ltd has declared 5% dividend, ex-date: 20 Sep 19

No Splits history available

No Bonus history available

No Rights history available
Quality key factors
Valuation key factors
Technicals key factors
 Technical Indicator Scale: Bearish, Mildly Bearish, Sideways, Mildly Bullish, Bullish Turned
 Shareholding Snapshot : Jun 2026
Shareholding Compare (%holding)
Non Institution
None
Held by 0 Schemes
Held by 0 FIIs
Vijay Shantiswarup Gupta (17.6%)
Einstein Work Pte. Limited (23.41%)
16.71%
Quarterly Results Snapshot (Consolidated) - Mar'26 - YoY

YoY Growth in quarter ended Mar 2026 is 50.29% vs 38.64% in Mar 2025
YoY Growth in quarter ended Mar 2026 is 5,925.00% vs -96.85% in Mar 2025
Half Yearly Results Snapshot (Consolidated) - Sep'25
Growth in half year ended Sep 2025 is 26.04% vs 12.58% in Sep 2024
Growth in half year ended Sep 2025 is 2.73% vs -31.25% in Sep 2024
Nine Monthly Results Snapshot (Consolidated) - Dec'25
YoY Growth in nine months ended Dec 2025 is 34.33% vs 13.90% in Dec 2024
YoY Growth in nine months ended Dec 2025 is 98.44% vs -44.59% in Dec 2024
Annual Results Snapshot (Consolidated) - Mar'26
YoY Growth in year ended Mar 2026 is 39.53% vs 20.91% in Mar 2025
YoY Growth in year ended Mar 2026 is 277.10% vs -63.41% in Mar 2025
About Softtech Engineers Ltd

Company Coordinates


