
Compare Softtech Enginee with Similar Stocks
Stock DNA
Computers - Software & Consulting
INR 551 Cr (Micro Cap)
113.00
NA
0.00%
0.02
2.88%
3.21
Total Returns (Price + Dividend) 
Softtech Enginee for the last several years.
Risk Adjusted Returns v/s
Returns Beta

News

Softtech Engineers Ltd Upgraded to Buy on Strong Financial and Technical Momentum
Softtech Engineers Ltd has been upgraded from a Hold to a Buy rating following a comprehensive reassessment of its technical indicators, financial trends, valuation metrics, and overall quality. This upgrade reflects the company’s robust quarterly results, improved market momentum, and sustained outperformance against benchmarks, signalling renewed investor confidence in this micro-cap software and consulting firm.
Read full news article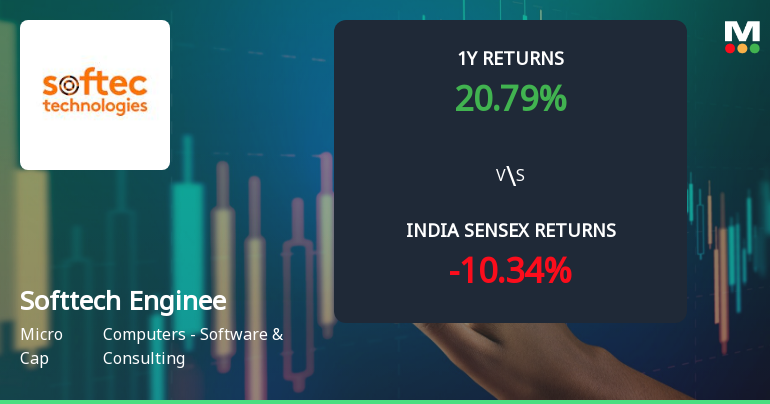
Softtech Engineers Ltd Technical Momentum Shifts Signal Bullish Outlook
Softtech Engineers Ltd has demonstrated a notable shift in its technical momentum, moving from a mildly bullish stance to a more confident bullish trend. This transition is supported by a confluence of technical indicators including MACD, RSI, Bollinger Bands, and moving averages, signalling renewed investor interest and potential upside in the micro-cap software consulting stock.
Read full news article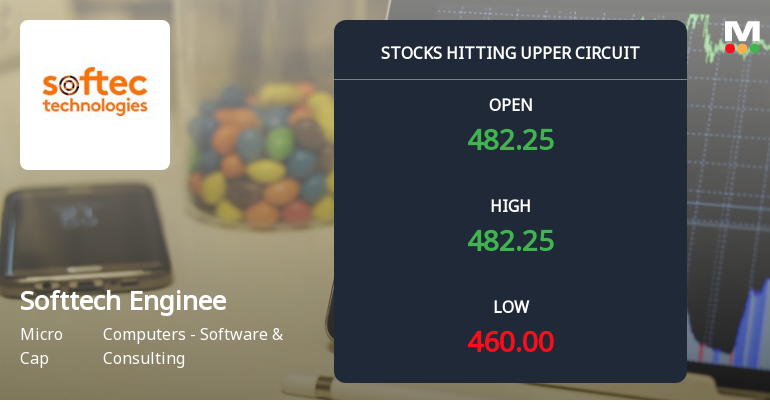
Softtech Engineers Ltd Locks at Upper Circuit With 4.68% Gain — Buyers Queue, Sellers Absent
At Rs 482.25, the buying was done — not because demand dried up, but because the exchange wouldn't let the stock go any higher. Softtech Engineers Ltd locked at its upper circuit of 4.68% on 1 Jun 2026, with buyers queuing and no sellers willing to part with shares.
Read full news article Announcements
Announcement under Regulation 30 (LODR)-Earnings Call Transcript
04-Jun-2026 | Source : BSETranscript of the Earnings Call for Q4 & FY 2025-26 results held on June 2 2026
Announcement under Regulation 30 (LODR)-Analyst / Investor Meet - Outcome
02-Jun-2026 | Source : BSEPursuant to Regulation 46 and 30 read with Part A of Schedule III of the SEBI (Listing Obligations and Disclosure Requirements) Regulations 2015 we hereby inform you that the audio recording of the Earnings Call for Q4 & FY 2025-26 Results held on June 2 2026 has been made available on the Companys website.
Announcement under Regulation 30 (LODR)-Press Release / Media Release
01-Jun-2026 | Source : BSESoftTech Engineers Limited has launched CivitTWIN - Indias first AI powered Digital Approval TWIN which is developed in collaboration with Brihanmumbai Municipal Corporation (BMC)
Corporate Actions

No Upcoming Board Meetings

Softtech Engineers Ltd has declared 5% dividend, ex-date: 20 Sep 19

No Splits history available

No Bonus history available

No Rights history available
Quality key factors
Valuation key factors
Technicals key factors
 Technical Indicator Scale: Bearish, Mildly Bearish, Sideways, Mildly Bullish, Bullish Turned
 Shareholding Snapshot : Mar 2026
Shareholding Compare (%holding)
Non Institution
None
Held by 0 Schemes
Held by 0 FIIs
Vijay Shantiswarup Gupta (17.6%)
Einstein Work Pte. Limited (23.41%)
15.88%
Quarterly Results Snapshot (Consolidated) - Mar'26 - YoY

YoY Growth in quarter ended Mar 2026 is 50.29% vs 38.64% in Mar 2025
YoY Growth in quarter ended Mar 2026 is 5,925.00% vs -96.85% in Mar 2025
Half Yearly Results Snapshot (Consolidated) - Sep'25
Growth in half year ended Sep 2025 is 26.04% vs 12.58% in Sep 2024
Growth in half year ended Sep 2025 is 2.73% vs -31.25% in Sep 2024
Nine Monthly Results Snapshot (Consolidated) - Dec'25
YoY Growth in nine months ended Dec 2025 is 34.33% vs 13.90% in Dec 2024
YoY Growth in nine months ended Dec 2025 is 98.44% vs -44.59% in Dec 2024
Annual Results Snapshot (Consolidated) - Mar'26
YoY Growth in year ended Mar 2026 is 39.53% vs 20.91% in Mar 2025
YoY Growth in year ended Mar 2026 is 277.10% vs -63.41% in Mar 2025
About Softtech Engineers Ltd

Company Coordinates


