
Compare Solex Energy with Similar Stocks
Dashboard
Healthy long term growth as Net Sales has grown by an annual rate of 81.20% and Operating profit at 116.16%
With a growth in Net Profit of 364.41%, the company declared Outstanding results in Mar 26
With ROCE of 32.5, it has a Attractive valuation with a 3 Enterprise value to Capital Employed
Despite the size of the company, domestic mutual funds hold only 0% of the company
Below par performance in long term as well as near term
Stock DNA
Other Electrical Equipment
INR 1,167 Cr (Small Cap)
12.00
56
0.05%
0.84
36.40%
4.58
Total Returns (Price + Dividend) 
Latest dividend: 0.5 per share ex-dividend date: Sep-22-2025
Risk Adjusted Returns v/s
Returns Beta

News

Solex Energy Ltd is Rated Hold
Solex Energy Ltd is rated 'Hold' by MarketsMOJO, with this rating last updated on 29 May 2026. While the rating change occurred on that date, the analysis and financial metrics discussed here reflect the stock's current position as of 08 June 2026, providing investors with an up-to-date view of the company's performance and outlook.
Read full news article
Solex Energy Ltd is Rated Hold by MarketsMOJO
Solex Energy Ltd is rated 'Hold' by MarketsMOJO, with this rating last updated on 29 May 2026. While the rating was adjusted on that date, the analysis and financial metrics discussed here reflect the stock's current position as of 08 June 2026, providing investors with the latest insights into the company’s performance and outlook.
Read full news article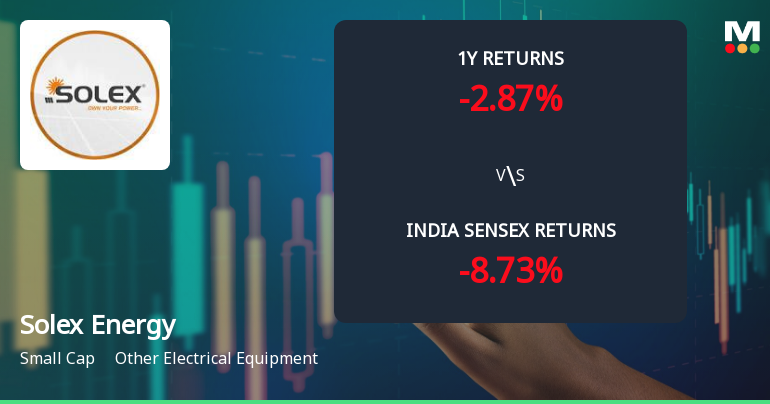
Solex Energy Ltd Faces Technical Momentum Shift Amid Mixed Indicator Signals
Solex Energy Ltd, a small-cap player in the Other Electrical Equipment sector, has experienced a notable shift in its technical momentum, reflected in a downgrade from a Buy to a Hold rating by MarketsMOJO on 29 May 2026. The stock’s recent price action and technical indicators reveal a complex picture of mildly bearish trends interspersed with pockets of bullish signals, prompting investors to reassess their positions amid a challenging market backdrop.
Read full news article Announcements
Solex Energy Limited - Clarification - Financial Results
18-Nov-2019 | Source : NSESolex Energy Limitedmited for the quarter ended 30-Sep-2019 with respect to Regulation 33 of the SEBI (Listing Obligations and Disclosure Requirements) Regulations, 2015.
Solex Energy Limited - Resignation
15-Nov-2019 | Source : NSESolex Energy Limited has informed the Exchange regarding Resignation of Mr Mahendrabhai Lallubhai Macchi as Non- Executive Independent Director of the company w.e.f. November 14, 2019.
Corporate Actions

No Upcoming Board Meetings

Solex Energy Ltd has declared 5% dividend, ex-date: 22 Sep 25

No Splits history available

Solex Energy Ltd has announced 1:4 bonus issue, ex-date: 20 Sep 24

No Rights history available
Quality key factors
Valuation key factors
Technicals key factors
 Technical Indicator Scale: Bearish, Mildly Bearish, Sideways, Mildly Bullish, Bullish Turned
 Shareholding Snapshot : Mar 2026
Shareholding Compare (%holding)
Promoters
None
Held by 0 Schemes
Held by 3 FIIs (0.13%)
Anil Rathi (7.41%)
None
22.94%
Quarterly Results Snapshot (Standalone) - Mar'26 - YoY
Not Applicable: The company has declared_date for only one period
Not Applicable: The company has declared_date for only one period
Half Yearly Results Snapshot (Consolidated) - Sep'25

Growth in half year ended Sep 2025 is 6.55% vs 42.45% in Mar 2025
Growth in half year ended Sep 2025 is 1.34% vs 121.54% in Mar 2025
Nine Monthly Results Snapshot (Consolidated) - Dec'25

YoY Growth in nine months ended Dec 2025 is 79.62% vs -58.32% in Dec 2024
YoY Growth in nine months ended Dec 2025 is 40.38% vs -53.72% in Dec 2024
Annual Results Snapshot (Consolidated) - Mar'26
YoY Growth in year ended Mar 2026 is 144.34% vs 80.97% in Mar 2025
YoY Growth in year ended Mar 2026 is 131.57% vs 374.91% in Mar 2025
About Solex Energy Ltd

Company Coordinates


