
Compare Solid Stone Co with Similar Stocks
Dashboard
Weak Long Term Fundamental Strength with an average Return on Capital Employed (ROCE) of 6.58%
- Poor long term growth as Net Sales has grown by an annual rate of 8.34% and Operating profit at 16.87% over the last 5 years
- Low ability to service debt as the company has a high Debt to EBITDA ratio of 4.27 times
Below par performance in long term as well as near term
Total Returns (Price + Dividend) 
Latest dividend: 0.6 per share ex-dividend date: Sep-19-2014
Risk Adjusted Returns v/s
Returns Beta

News
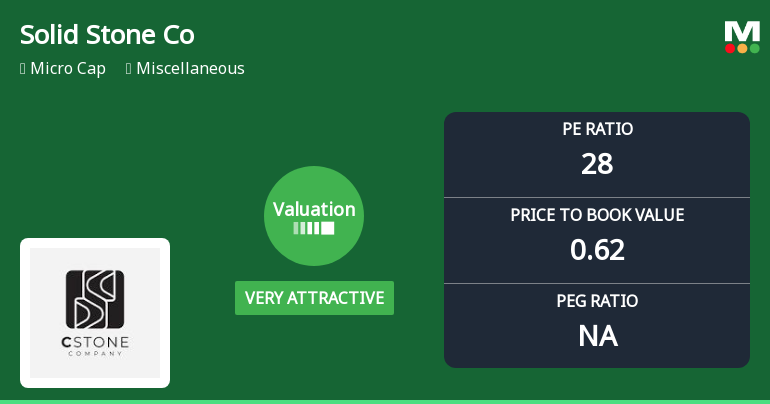
Solid Stone Company Ltd Valuation Shifts to Very Attractive Amid Mixed Market Returns
Solid Stone Company Ltd has seen a notable improvement in its valuation parameters, shifting from an attractive to a very attractive rating, despite a challenging performance relative to the broader market. This micro-cap stock’s price-to-earnings (P/E) and price-to-book value (P/BV) ratios now present a compelling case for value investors, even as its returns lag behind the Sensex over multiple time horizons.
Read full news article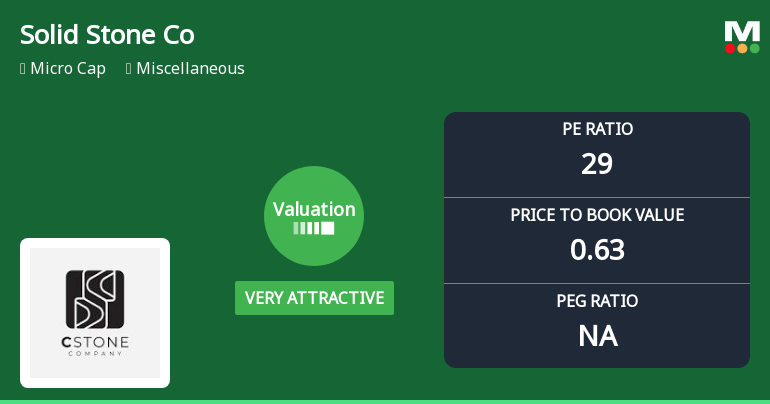
Solid Stone Company Ltd Valuation Shifts to Very Attractive Amid Mixed Returns
Solid Stone Company Ltd has seen a notable shift in its valuation parameters, moving from an attractive to a very attractive grade, despite a challenging return profile over recent years. With a current price of ₹26.61 and a micro-cap market classification, the stock’s price-to-earnings (P/E) and price-to-book value (P/BV) ratios now present a compelling case for value investors seeking opportunities in the miscellaneous sector.
Read full news article
Solid Stone Company Ltd Valuation Shifts to Attractive Amid Mixed Market Returns
Solid Stone Company Ltd has witnessed a notable shift in its valuation parameters, moving from a very attractive to an attractive rating, despite a challenging market backdrop and mixed returns relative to the broader Sensex index. This article analyses the recent changes in key valuation metrics, compares them with peer averages, and assesses the implications for investors navigating this micro-cap stock in the miscellaneous sector.
Read full news article Announcements
Compliances-Reg.24(A)-Annual Secretarial Compliance
21-May-2026 | Source : BSESubmission of Annual Secretarial Compliance Report under Regulation 24A of SEBI (LODR) 2015
Submission Of Audited Standalone And Consolidated Financial Results For Quarter And Year Ended 31St March 2026
12-May-2026 | Source : BSEPursuant to Regulation 30 and 33 of SEBI (LODR) 2015 we hereby submit Audited Standalone and Consolidated Financial Results approved by the Board of Directors of the Company at its Meeting held today.
Board Meeting Intimation for Approval And Take On Record The Audited Standalone And Consolidated Financial Results Of The Company For The Year Ended 31St March 2026
04-May-2026 | Source : BSESolid Stone Company Ltdhas informed BSE that the meeting of the Board of Directors of the Company is scheduled on 12/05/2026 inter alia to consider and approve and take on record the Audited Standalone and Consolidated financial results of the company for the Year ended 31st March 2026
Corporate Actions

No Upcoming Board Meetings

Solid Stone Company Ltd has declared 6% dividend, ex-date: 19 Sep 14

No Splits history available

No Bonus history available

No Rights history available
Quality key factors
Valuation key factors
Technicals key factors
 Technical Indicator Scale: Bearish, Mildly Bearish, Sideways, Mildly Bullish, Bullish Turned
 Shareholding Snapshot : Jun 2026
Shareholding Compare (%holding)
Promoters
None
Held by 0 Schemes
Held by 0 FIIs
Prakash B Khakhar (31.97%)
Falguni S Nayar (3.42%)
20.27%
Quarterly Results Snapshot (Consolidated) - Mar'26 - QoQ

QoQ Growth in quarter ended Mar 2026 is 92.77% vs -25.40% in Dec 2025
QoQ Growth in quarter ended Mar 2026 is 650.00% vs -66.67% in Dec 2025
Half Yearly Results Snapshot (Consolidated) - Sep'25
Growth in half year ended Sep 2025 is 4.08% vs -2.62% in Sep 2024

Growth in half year ended Sep 2025 is -52.94% vs -5.56% in Sep 2024
Nine Monthly Results Snapshot (Consolidated) - Dec'25
YoY Growth in nine months ended Dec 2025 is -16.72% vs 19.73% in Dec 2024
YoY Growth in nine months ended Dec 2025 is -67.74% vs 10.71% in Dec 2024
Annual Results Snapshot (Consolidated) - Mar'26
YoY Growth in year ended Mar 2026 is -7.01% vs 15.24% in Mar 2025
YoY Growth in year ended Mar 2026 is -39.76% vs -2.35% in Mar 2025
About Solid Stone Company Ltd

Company Coordinates


