
Compare Solitaire Mach. with Similar Stocks
Dashboard
Weak Long Term Fundamental Strength with an average Return on Equity (ROE) of 9.80%
- Poor long term growth as Net Sales has grown by an annual rate of 4.92% and Operating profit at 12.85% over the last 5 years
- Company's ability to service its debt is weak with a poor EBIT to Interest (avg) ratio of 1.98
Flat results in Dec 25
With ROCE of 8.6, it has a Expensive valuation with a 2.2 Enterprise value to Capital Employed
Underperformed the market in the last 1 year
Stock DNA
Industrial Manufacturing
INR 43 Cr (Micro Cap)
33.00
34
0.00%
0.14
7.20%
2.36
Total Returns (Price + Dividend) 
Latest dividend: 1.7 per share ex-dividend date: Jun-21-2024
Risk Adjusted Returns v/s
Returns Beta

News
When is the next results date for Solitaire Machine Tools Ltd?
The next results date for Solitaire Machine Tools Ltd is scheduled for 09 May 2026....
Read full news article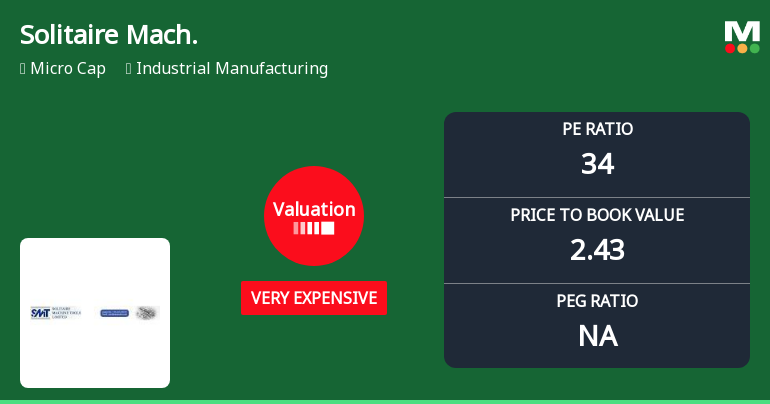
Solitaire Machine Tools Ltd Valuation Shifts to Very Expensive Amid Mixed Returns
Solitaire Machine Tools Ltd, a micro-cap player in the industrial manufacturing sector, has seen its valuation metrics shift markedly towards the very expensive territory despite a mixed performance track record. With a recent upgrade in its Mojo Grade to Strong Sell and a notable rise in its price-to-earnings ratio, investors are urged to carefully assess the stock’s price attractiveness relative to its historical and peer benchmarks.
Read full news article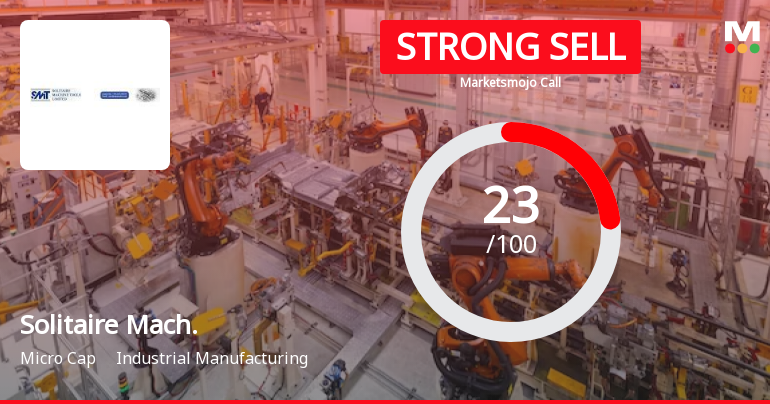
Solitaire Machine Tools Ltd is Rated Strong Sell
Solitaire Machine Tools Ltd is rated Strong Sell by MarketsMOJO. This rating was last updated on 15 Sep 2025, reflecting a reassessment of the stock’s outlook. However, all fundamentals, returns, and financial metrics discussed below are current as of 22 April 2026, providing investors with the latest comprehensive view of the company’s position.
Read full news article Announcements
Corporate Action-Board to consider Dividend
27-Apr-2026 | Source : BSEWe hereby inform that Meeting of Board of Directors of the Company is scheduled to be held on 9th May 2026 at 11: AM at the registerd office to consider and recommend dividend on Equity Shares if any for the Financial Year ended 31st March 2026.
Board Meeting Intimation for Intimation Of Board Meeting For Approval And Adoption Of Audited Financial Results For The Quarter & Year Ended March 31 2026.
27-Apr-2026 | Source : BSESolitaire Machine Tools Ltdhas informed BSE that the meeting of the Board of Directors of the Company is scheduled on 09/05/2026 inter alia to consider and approve 1. To consider and approve the Standalone Audited Financial Statements for the year ended 31st March 2026 and Audited Financial Results for the Quarter & year ended 31st March 2026 together with Audit Report; 2. To Consider and recommend dividend on Equity Shares if any for the Financial year ended 31st March 2026. In continuation of our earlier intimation dated 25th March 2026 regarding Closure of Trading Window the Trading Window for dealing in securities of the Company has been already closed from 01st April 2026 and shall remain closed up to 11th May 2026 (both days inclusive) i.e. till 48 hours after the declaration of Audited Financial Results of the Company for the quarter & Year ended on 31st March 2026.
Declaration Under Regulation 31(4) Of SEBI (Substantial Acquisition Of Shares & Takeovers) Regulations 2011
20-Apr-2026 | Source : BSEWe are enclosing herewith the Declarations under Regulation 31(4) of SEBI (SAST) Regulations 2011 received from promoters and on behalf of the Promoter Group for the year ended March 31 2026.
Corporate Actions

09 May 2026

Solitaire Machine Tools Ltd has declared 17% dividend, ex-date: 21 Jun 24

No Splits history available

No Bonus history available

No Rights history available
Quality key factors
Valuation key factors
Technicals key factors
 Technical Indicator Scale: Bearish, Mildly Bearish, Sideways, Mildly Bullish, Bullish Turned
 Shareholding Snapshot : Mar 2026
Shareholding Compare (%holding)
Non Institution
None
Held by 0 Schemes
Held by 0 FIIs
Harsh Hemendra Badani (17.13%)
Aditya Pankaj Shah (4.82%)
46.17%
Quarterly Results Snapshot (Standalone) - Dec'25 - YoY

YoY Growth in quarter ended Dec 2025 is -47.36% vs 21.57% in Dec 2024
YoY Growth in quarter ended Dec 2025 is -53.52% vs 97.22% in Dec 2024
Half Yearly Results Snapshot (Standalone) - Sep'25
Growth in half year ended Sep 2025 is -17.94% vs 0.00% in Sep 2024
Growth in half year ended Sep 2025 is -64.52% vs 19.23% in Sep 2024
Nine Monthly Results Snapshot (Standalone) - Dec'25
YoY Growth in nine months ended Dec 2025 is -30.92% vs 8.49% in Dec 2024
YoY Growth in nine months ended Dec 2025 is -59.76% vs 43.86% in Dec 2024
Annual Results Snapshot (Standalone) - Mar'25
YoY Growth in year ended Mar 2025 is 7.86% vs 11.73% in Mar 2024

YoY Growth in year ended Mar 2025 is 30.56% vs 12.50% in Mar 2024
About Solitaire Machine Tools Ltd

Company Coordinates


