
Compare Soliton Systems KK with Similar Stocks
Stock DNA
Computers - Software & Consulting
JPY 42,360 Million (Small Cap)
15.00
NA
0.00%
-1.23
19.56%
3.42
Revenue and Profits:
Net Sales:
4,125 Million
(Quarterly Results - Jun 2025)
Net Profit:
175 Million
Total Returns (Price + Dividend) 
TimePeriod
Price Return
Dividend Return
Total Return
3 Months
64.59%
0%
64.59%
6 Months
65.7%
0%
65.7%
1 Year
67.7%
0%
67.7%
2 Years
66.55%
0%
66.55%
3 Years
52.98%
0%
52.98%
4 Years
17.59%
0%
17.59%
5 Years
21.54%
0%
21.54%
Soliton Systems KK for the last several years.
Risk Adjusted Returns v/s
News
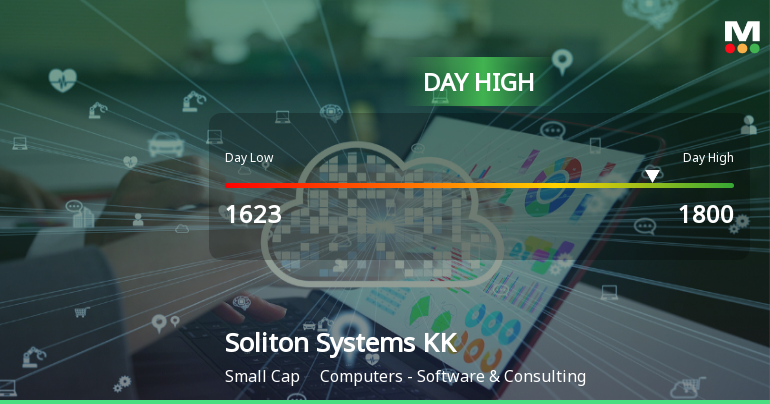
Soliton Systems Soars 7.33%, Hits Intraday High of JPY 1,800.00
Soliton Systems KK's stock surged on November 7, 2025, reaching an intraday high of JPY 1,800.00. The company has outperformed the Japan Nikkei 225 over the past year, showcasing strong financial health with a high return on equity and low debt-to-equity ratio, despite recent declines in profit and sales.
Read full news article Announcements

No announcement available
Corporate Actions
No corporate action available
Quality key factors
Factor
Value
Sales Growth (5y)
3.49%
EBIT Growth (5y)
15.16%
EBIT to Interest (avg)
100.00
Debt to EBITDA (avg)
0
Net Debt to Equity (avg)
-1.22
Sales to Capital Employed (avg)
1.65
Tax Ratio
15.60%
Dividend Payout Ratio
55.87%
Pledged Shares
0
Institutional Holding
0
ROCE (avg)
557.71%
ROE (avg)
18.89%
Valuation key factors
Factor
Value
P/E Ratio
15
Industry P/E
Price to Book Value
2.19
EV to EBIT
5.35
EV to EBITDA
4.60
EV to Capital Employed
-4.30
EV to Sales
0.62
PEG Ratio
NA
Dividend Yield
NA
ROCE (Latest)
Negative Capital Employed
ROE (Latest)
14.58%
Technicals key factors
Indicator
Weekly
Monthly
MACD
Mildly Bearish
Bullish
RSI
No Signal
No Signal
Bollinger Bands
Mildly Bullish
Mildly Bullish
Moving Averages
Mildly Bullish (Daily)
KST
Bullish
Bullish
Dow Theory
Mildly Bearish
Mildly Bullish
OBV
Mildly Bearish
Bullish
 Technical Indicator Scale: Bearish, Mildly Bearish, Sideways, Mildly Bullish, Bullish Turned
 Shareholding Snapshot
No data for shareholding present.
Shareholding Compare (%holding)
No data for shareholding present.
Quarterly Results Snapshot (Consolidated) - Jun'25 - QoQ
Jun'25
Mar'25
Change(%)
Net Sales
4,125.00
4,585.00
-10.03%
Operating Profit (PBDIT) excl Other Income
271.00
669.00
-59.49%
Interest
0.00
0.00
Exceptional Items
-3.00
-13.00
76.92%
Consolidate Net Profit
175.00
399.00
-56.14%
Operating Profit Margin (Excl OI)
48.50%
129.60%
-8.11%
USD in Million.

Net Sales
QoQ Growth in quarter ended Jun 2025 is -10.03% vs -14.49% in Mar 2025
Consolidated Net Profit
QoQ Growth in quarter ended Jun 2025 is -56.14% vs -60.02% in Mar 2025
Annual Results Snapshot (Consolidated) - Dec'24
Dec'24
Dec'23
Change(%)
Net Sales
18,606.00
19,058.00
-2.37%
Operating Profit (PBDIT) excl Other Income
2,391.00
2,924.00
-18.23%
Interest
0.00
0.00
Exceptional Items
-9.00
-12.00
25.00%
Consolidate Net Profit
1,720.00
1,934.00
-11.07%
Operating Profit Margin (Excl OI)
109.90%
136.90%
-2.70%
USD in Million.
Net Sales
YoY Growth in year ended Dec 2024 is -2.37% vs -3.54% in Dec 2023

Consolidated Net Profit
YoY Growth in year ended Dec 2024 is -11.07% vs 22.02% in Dec 2023
About Soliton Systems KK

Soliton Systems KK
Computers - Software & Consulting
No Details Available.
Company Coordinates
No Company Details Available
InfinHub Market Technologies FZ-LLC, Building-2, Unit 112, Dubai Internet City, Dubai, United Arab Emirates
GET THE MARKETSMOJO APP


Company
Stocks
Portfolio


"Investment in securities markets are subject to market risk. Read all the related documents carefully before investing."