
Compare Somi Conv.Belt. with Similar Stocks
Dashboard
Poor Management Efficiency with a low ROE of 5.52%
- The company has been able to generate a Return on Equity (avg) of 5.52% signifying low profitability per unit of shareholders funds
Poor long term growth as Operating profit has grown by an annual rate 8.96% of over the last 5 years
Underperformed the market in the last 1 year
Stock DNA
Industrial Manufacturing
INR 116 Cr (Micro Cap)
23.00
72
0.00%
0.05
6.17%
1.41
Total Returns (Price + Dividend) 
Latest dividend: 0.5 per share ex-dividend date: Sep-19-2018
Risk Adjusted Returns v/s
Returns Beta

News
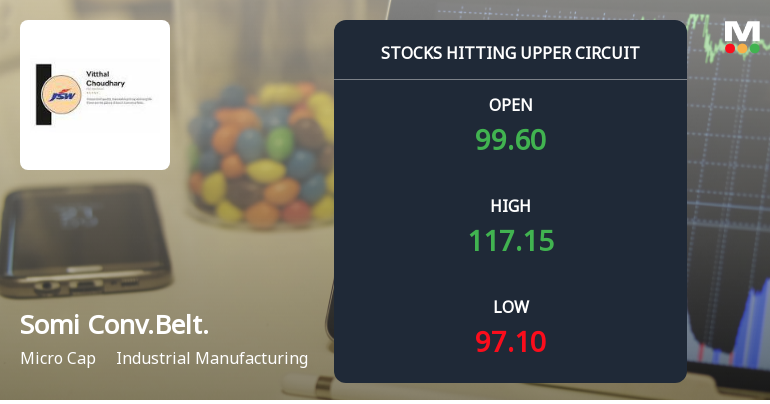
Somi Conveyor Beltings Ltd Locks at Upper Circuit With 20% Gain — Buyers Queue, Sellers Absent
At Rs 117.37, the buying was done — not because demand dried up, but because the exchange wouldn't let the stock go any higher. Somi Conveyor Beltings Ltd locked at its upper circuit of 20% on 25 Jun 2026, with buyers queuing and no sellers willing to part with shares.
Read full news article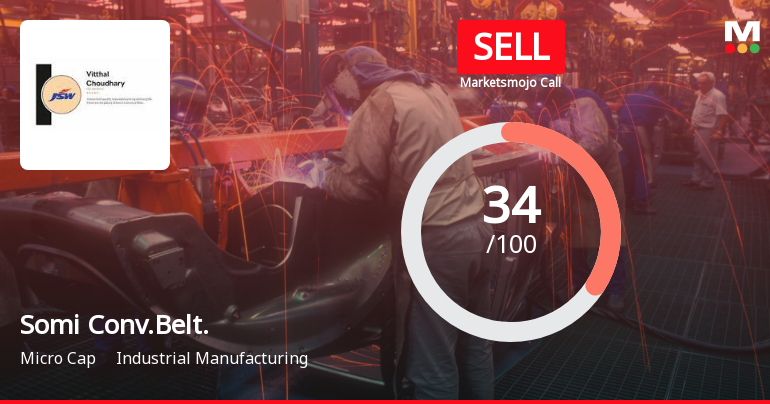
Somi Conveyor Beltings Ltd Upgraded to Sell on Technical Improvements Despite Financial Challenges
Somi Conveyor Beltings Ltd, a micro-cap player in the industrial manufacturing sector, has seen its investment rating upgraded from Strong Sell to Sell as of 22 June 2026. This change reflects a nuanced shift in the company’s technical outlook despite ongoing challenges in financial performance and valuation metrics. The upgrade is primarily driven by improvements in technical indicators, while fundamental concerns persist.
Read full news article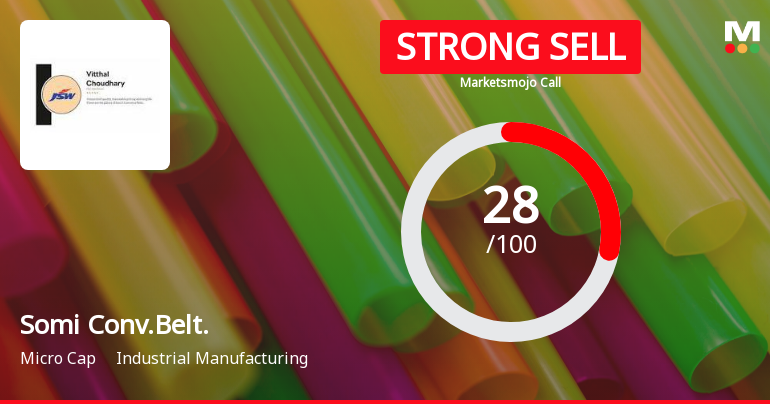
Somi Conveyor Beltings Ltd is Rated Strong Sell
Somi Conveyor Beltings Ltd is rated Strong Sell by MarketsMOJO. This rating was last updated on 01 June 2026, reflecting a reassessment of the stock’s outlook. However, all fundamentals, returns, and financial metrics discussed here are current as of 16 June 2026, providing investors with the latest perspective on the company’s performance and prospects.
Read full news article Announcements
Audited Financial Results For The Fourth Quarter (Q4) And Year Ended 31St March 2026.
20-May-2026 | Source : BSEAudited Financial Results for the Fourth Quarter (Q4) and Year ended 31st March2026.
Announcement under Regulation 30 (LODR)-Change in Management
20-May-2026 | Source : BSEIntimation under Regulation 30 of SEBI (LODR) Regulations 2015 regarding appointment of Internal Auditor and Cost Auditor.
Board Meeting Outcome for Outcome Of The 3Rd (2026) Board Meeting Held Today On 20/05/2026.
20-May-2026 | Source : BSEOutcome of the 3rd (2026) Board Meeting held today on 20/05/2026.
Corporate Actions

No Upcoming Board Meetings

Somi Conveyor Beltings Ltd has declared 5% dividend, ex-date: 19 Sep 18

No Splits history available

No Bonus history available

No Rights history available
Quality key factors
Valuation key factors
Technicals key factors
 Technical Indicator Scale: Bearish, Mildly Bearish, Sideways, Mildly Bullish, Bullish Turned
 Shareholding Snapshot : Mar 2026
Shareholding Compare (%holding)
Promoters
None
Held by 0 Schemes
Held by 1 FIIs (0.0%)
Om Prakash Bhansali (37.5%)
Transland Shares Private Limited (3.87%)
21.46%
Quarterly Results Snapshot (Standalone) - Mar'26 - QoQ

QoQ Growth in quarter ended Mar 2026 is -53.87% vs 90.06% in Dec 2025
QoQ Growth in quarter ended Mar 2026 is -75.21% vs 176.74% in Dec 2025
Half Yearly Results Snapshot (Standalone) - Sep'25
Growth in half year ended Sep 2025 is -6.79% vs 9.82% in Sep 2024
Growth in half year ended Sep 2025 is -33.76% vs 62.83% in Sep 2024
Nine Monthly Results Snapshot (Standalone) - Dec'25
YoY Growth in nine months ended Dec 2025 is 8.45% vs 20.86% in Dec 2024
YoY Growth in nine months ended Dec 2025 is -3.27% vs 71.91% in Dec 2024
Annual Results Snapshot (Standalone) - Mar'26

YoY Growth in year ended Mar 2026 is -0.49% vs -0.85% in Mar 2025
YoY Growth in year ended Mar 2026 is -8.38% vs 20.66% in Mar 2025
About Somi Conveyor Beltings Ltd

Company Coordinates


