[
  {
    "link": "quarterly",
    "btn_text": "All Quarterly Results",
    "header": "Quarterly Results Snapshot (Consolidated) - Mar'26 - QoQ",
    "rhs": [
      {
        "prefix": "Net Sales ",
        "suffix": "QoQ Growth in quarter ended Mar 2026 is 4.81% vs 5.40% in Dec 2025",
        "dir": -1
      },
      {
        "prefix": "Consolidated Net Profit ",
        "suffix": "QoQ Growth in quarter ended Mar 2026 is 27.28% vs -12.73% in Dec 2025",
        "dir": 1
      }
    ],
    "table": {
      "header": [
        "Mar'26",
        "Dec'25",
        "Change(%)"
      ],
      "body": [
        {
          "field": "Net Sales",
          "val1": "1,257.50",
          "val2": "1,199.76",
          "chgp": "4.81%",
          "chgp_class": "positive"
        },
        {
          "field": "Operating Profit (PBDIT) excl Other Income",
          "val1": "295.85",
          "val2": "295.93",
          "chgp": "-0.03%",
          "chgp_class": "negative"
        },
        {
          "field": "Interest",
          "val1": "7.50",
          "val2": "5.49",
          "chgp": "36.61%",
          "chgp_class": "negative"
        },
        {
          "field": "Exceptional Items",
          "val1": "0.00",
          "val2": "-40.14",
          "chgp": "100.00%",
          "chgp_class": "positive"
        },
        {
          "field": "Consolidate Net Profit",
          "val1": "191.92",
          "val2": "150.78",
          "chgp": "27.28%",
          "chgp_class": "positive"
        },
        {
          "field": "Operating Profit Margin (Excl OI)",
          "val1": "23.53%",
          "val2": "24.67%",
          "chgp": "-1.14%",
          "chgp_class": "negative"
        }
      ]
    }
  },
  {
    "link": "half-yearly",
    "btn_text": "All Half Yearly Results",
    "header": "Half Yearly Results Snapshot (Consolidated) - Sep'25",
    "rhs": [
      {
        "prefix": "Net Sales ",
        "suffix": " Growth in half year ended Sep 2025 is 9.86% vs 19.39% in Sep 2024",
        "dir": -1
      },
      {
        "prefix": "Consolidated Net Profit ",
        "suffix": " Growth in half year ended Sep 2025 is 4.05% vs 21.21% in Sep 2024",
        "dir": -1
      }
    ],
    "table": {
      "header": [
        "Sep'25",
        "Sep'24",
        "Change(%)"
      ],
      "body": [
        {
          "field": "Net Sales",
          "val1": "1,992.20",
          "val2": "1,813.36",
          "chgp": "9.86%",
          "chgp_class": "positive"
        },
        {
          "field": "Operating Profit (PBDIT) excl Other Income",
          "val1": "489.39",
          "val2": "501.31",
          "chgp": "-2.38%",
          "chgp_class": "negative"
        },
        {
          "field": "Interest",
          "val1": "10.49",
          "val2": "19.18",
          "chgp": "-45.31%",
          "chgp_class": "positive"
        },
        {
          "field": "Exceptional Items",
          "val1": "-10.84",
          "val2": "-11.01",
          "chgp": "1.54%",
          "chgp_class": "positive"
        },
        {
          "field": "Consolidate Net Profit",
          "val1": "297.48",
          "val2": "285.90",
          "chgp": "4.05%",
          "chgp_class": "positive"
        },
        {
          "field": "Operating Profit Margin (Excl OI)",
          "val1": "24.57%",
          "val2": "27.65%",
          "chgp": "-3.08%",
          "chgp_class": "negative"
        }
      ]
    }
  },
  {
    "link": "nine-monthly",
    "btn_text": "All Nine Monthly Results",
    "header": "Nine Monthly Results Snapshot (Consolidated) - Dec'25",
    "rhs": [
      {
        "prefix": "Net Sales ",
        "suffix": "YoY Growth in nine months ended Dec 2025 is 19.05% vs 16.54% in Dec 2024",
        "dir": 1
      },
      {
        "prefix": "Consolidated Net Profit ",
        "suffix": "YoY Growth in nine months ended Dec 2025 is 2.56% vs 18.58% in Dec 2024",
        "dir": -1
      }
    ],
    "table": {
      "header": [
        "Dec'25",
        "Dec'24",
        "Change(%)"
      ],
      "body": [
        {
          "field": "Net Sales",
          "val1": "3,191.96",
          "val2": "2,681.27",
          "chgp": "19.05%",
          "chgp_class": "positive"
        },
        {
          "field": "Operating Profit (PBDIT) excl Other Income",
          "val1": "785.32",
          "val2": "735.48",
          "chgp": "6.78%",
          "chgp_class": "positive"
        },
        {
          "field": "Interest",
          "val1": "15.98",
          "val2": "24.95",
          "chgp": "-35.95%",
          "chgp_class": "positive"
        },
        {
          "field": "Exceptional Items",
          "val1": "-50.98",
          "val2": "-16.71",
          "chgp": "-205.09%",
          "chgp_class": "negative"
        },
        {
          "field": "Consolidate Net Profit",
          "val1": "448.26",
          "val2": "437.09",
          "chgp": "2.56%",
          "chgp_class": "positive"
        },
        {
          "field": "Operating Profit Margin (Excl OI)",
          "val1": "24.60%",
          "val2": "27.43%",
          "chgp": "-2.83%",
          "chgp_class": "negative"
        }
      ]
    }
  },
  {
    "link": "annual",
    "btn_text": "All Annual Results",
    "header": "Annual Results Snapshot (Consolidated) - Mar'26",
    "rhs": [
      {
        "prefix": "Net Sales ",
        "suffix": "YoY Growth in year ended Mar 2026 is 25.48% vs 11.34% in Mar 2025",
        "dir": 1
      },
      {
        "prefix": "Consolidated Net Profit ",
        "suffix": "YoY Growth in year ended Mar 2026 is 6.48% vs 16.23% in Mar 2025",
        "dir": -1
      }
    ],
    "table": {
      "header": [
        "Mar'26",
        "Mar'25",
        "Change(%)"
      ],
      "body": [
        {
          "field": "Net Sales",
          "val1": "4,449.46",
          "val2": "3,546.02",
          "chgp": "25.48%",
          "chgp_class": "positive"
        },
        {
          "field": "Operating Profit (PBDIT) excl Other Income",
          "val1": "1,081.17",
          "val2": "966.76",
          "chgp": "11.83%",
          "chgp_class": "positive"
        },
        {
          "field": "Interest",
          "val1": "23.48",
          "val2": "30.17",
          "chgp": "-22.17%",
          "chgp_class": "positive"
        },
        {
          "field": "Exceptional Items",
          "val1": "-50.98",
          "val2": "-19.29",
          "chgp": "-164.28%",
          "chgp_class": "negative"
        },
        {
          "field": "Consolidate Net Profit",
          "val1": "640.17",
          "val2": "601.21",
          "chgp": "6.48%",
          "chgp_class": "positive"
        },
        {
          "field": "Operating Profit Margin (Excl OI)",
          "val1": "24.30%",
          "val2": "27.26%",
          "chgp": "-2.96%",
          "chgp_class": "negative"
        }
      ]
    }
  }
]Net Sales
1,257.50
1,199.76
Operating Profit (PBDIT) excl Other Income
295.85
295.93
Exceptional Items
0.00
-40.14
Consolidate Net Profit
191.92
150.78
Operating Profit Margin (Excl OI)
23.53%
24.67%
Values in Rs Cr.

Net Sales
QoQ Growth in quarter ended Mar 2026 is 4.81% vs 5.40% in Dec 2025

Consolidated Net Profit
QoQ Growth in quarter ended Mar 2026 is 27.28% vs -12.73% in Dec 2025
Net Sales
1,992.20
1,813.36
Operating Profit (PBDIT) excl Other Income
489.39
501.31
Exceptional Items
-10.84
-11.01
Consolidate Net Profit
297.48
285.90
Operating Profit Margin (Excl OI)
24.57%
27.65%
Values in Rs Cr.
Net Sales
Growth in half year ended Sep 2025 is 9.86% vs 19.39% in Sep 2024
Consolidated Net Profit
Growth in half year ended Sep 2025 is 4.05% vs 21.21% in Sep 2024
Net Sales
3,191.96
2,681.27
Operating Profit (PBDIT) excl Other Income
785.32
735.48
Exceptional Items
-50.98
-16.71
Consolidate Net Profit
448.26
437.09
Operating Profit Margin (Excl OI)
24.60%
27.43%
Values in Rs Cr.
Net Sales
YoY Growth in nine months ended Dec 2025 is 19.05% vs 16.54% in Dec 2024
Consolidated Net Profit
YoY Growth in nine months ended Dec 2025 is 2.56% vs 18.58% in Dec 2024
Net Sales
4,449.46
3,546.02
Operating Profit (PBDIT) excl Other Income
1,081.17
966.76
Exceptional Items
-50.98
-19.29
Consolidate Net Profit
640.17
601.21
Operating Profit Margin (Excl OI)
24.30%
27.26%
Values in Rs Cr.
Net Sales
YoY Growth in year ended Mar 2026 is 25.48% vs 11.34% in Mar 2025
Consolidated Net Profit
YoY Growth in year ended Mar 2026 is 6.48% vs 16.23% in Mar 2025


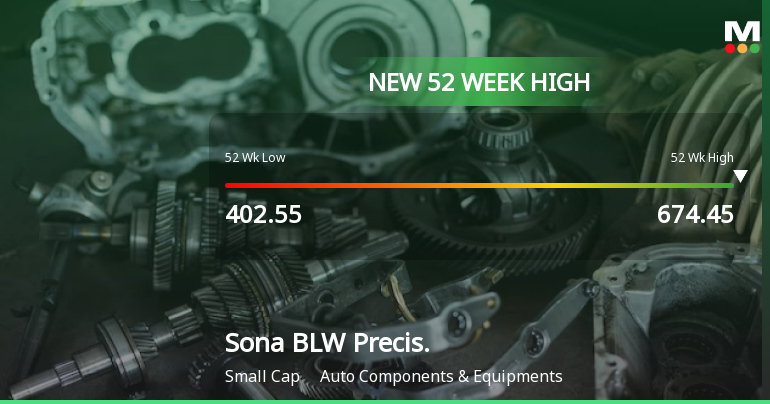
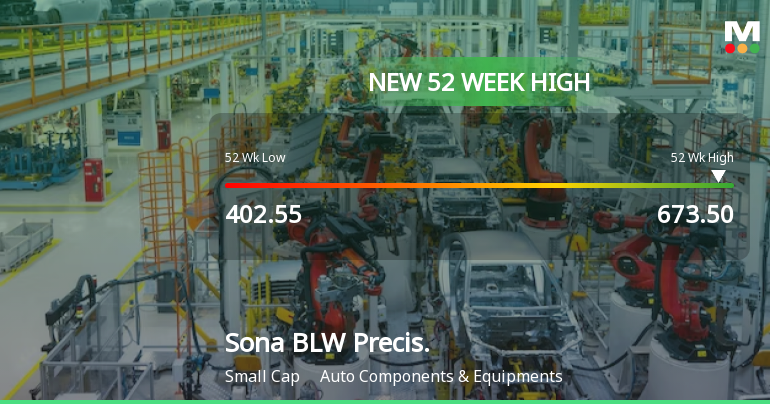


 Technical Indicator Scale: Bearish, Mildly Bearish, Sideways, Mildly Bullish, Bullish Turned


