
Compare Sonal Mercantile with Similar Stocks
Stock DNA
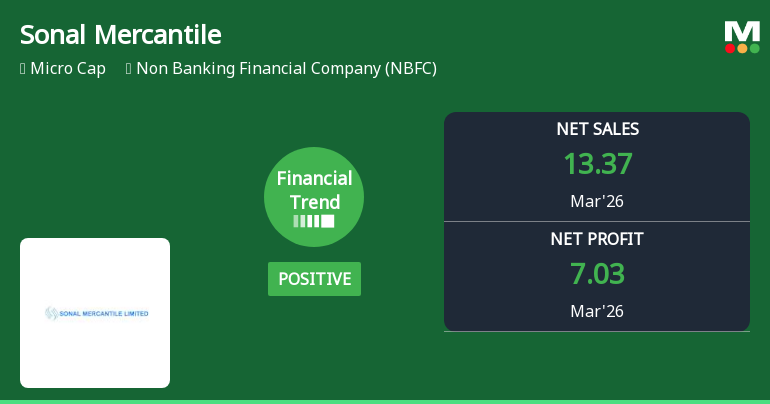
Non Banking Financial Company (NBFC)
INR Cr (Micro Cap)
5.00
9
0.00%
0.00
0.00%
0.00
Total Returns (Price + Dividend) 
Sonal Mercantile for the last several years.
Risk Adjusted Returns v/s
Returns Beta

News
Sonal Mercantile Ltd Reports Strong Quarterly Turnaround Amid Mixed Long-Term Returns
Sonal Mercantile Ltd, a micro-cap player in the Non Banking Financial Company (NBFC) sector, has demonstrated a notable financial turnaround in the quarter ended March 2026. The company’s latest quarterly results reveal significant improvements in revenue and operating profitability, reversing a previously negative trend and signalling a potential shift in its financial trajectory despite ongoing sector headwinds.
Read full news article
Sonal Mercantile Ltd is Rated Sell
Sonal Mercantile Ltd is rated 'Sell' by MarketsMOJO, with this rating last updated on 01 June 2026. While the rating was revised on this date, the analysis and financial metrics discussed here reflect the stock's current position as of 01 June 2026, providing investors with an up-to-date perspective on the company’s fundamentals, valuation, financial trends, and technical outlook.
Read full news article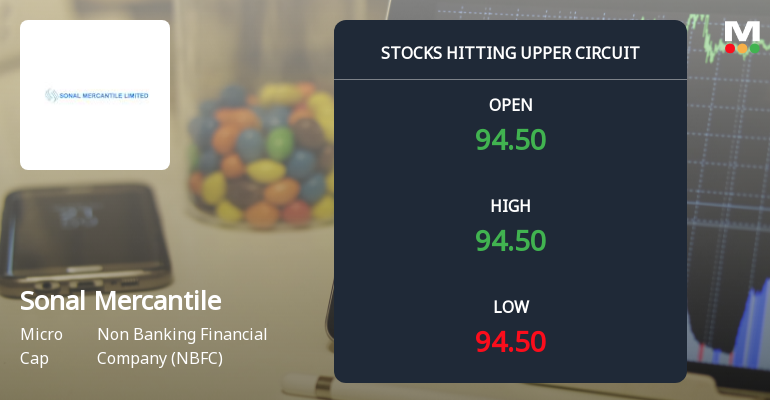
Sonal Mercantile Ltd Locks at Upper Circuit With 5.0% Gain — Buyers Queue, Sellers Absent
At Rs 94.5, the buying was done — not because demand dried up, but because the exchange wouldn't let the stock go any higher. Sonal Mercantile Ltd locked at its upper circuit of 5.0% on 1 Jun 2026, with buyers queuing and no sellers willing to part with shares.
Read full news article Announcements
Announcement under Regulation 30 (LODR)-Newspaper Publication
01-Jun-2026 | Source : BSEEnclosed Newspaper publication of Audited standalone and consolidated Financial results for financial year ended 31.03.2026
Board Meeting Outcome for Enclosed Audited Standalone And Consolidated Fiancial Reults For The Quarter And Year Ended 31.03.2026 And Other Businesses.
29-May-2026 | Source : BSEBoard meeting outcome for submission of audited standalone and consolidated fiancial reults for the quarter and year ended 31.03.2026 and other businesses.
Submission Of Audited Standalone And Consolidated Financial Results For The Quarter And Year Ended 31.03.2026 And Other Businesses.
29-May-2026 | Source : BSESubmission of Audited Stanalone and Consolidated Financial results for the quarter and year ended 31.03.2026 and other businesses.
Corporate Actions

No Upcoming Board Meetings

No Dividend history available

No Splits history available

No Bonus history available

No Rights history available
Quality key factors
Valuation key factors
Technicals key factors
 Technical Indicator Scale: Bearish, Mildly Bearish, Sideways, Mildly Bullish, Bullish Turned
 Shareholding Snapshot : Mar 2026
Shareholding Compare (%holding)
Non Institution
None
Held by 0 Schemes
Held by 0 FIIs
Ram Gopal Goyal & Sons Llp (24.92%)
Rudraveerya Developers Limited (24.74%)
27.04%
Quarterly Results Snapshot (Consolidated) - Mar'26 - QoQ

QoQ Growth in quarter ended Mar 2026 is 61.86% vs -15.63% in Dec 2025
QoQ Growth in quarter ended Mar 2026 is 172.48% vs -66.19% in Dec 2025
Half Yearly Results Snapshot (Consolidated) - Sep'25
Growth in half year ended Sep 2025 is 3.41% vs -6.04% in Sep 2024

Growth in half year ended Sep 2025 is 3.61% vs 51.02% in Sep 2024
Nine Monthly Results Snapshot (Consolidated) - Dec'25
YoY Growth in nine months ended Dec 2025 is 2.47% vs -7.99% in Dec 2024
YoY Growth in nine months ended Dec 2025 is -18.52% vs 35.52% in Dec 2024
Annual Results Snapshot (Consolidated) - Mar'26
YoY Growth in year ended Mar 2026 is 15.50% vs -10.25% in Mar 2025
YoY Growth in year ended Mar 2026 is -20.58% vs 33.55% in Mar 2025
About Sonal Mercantile Ltd

Company Coordinates


