
Compare Sonam with Similar Stocks
Stock DNA
Electronics & Appliances
INR 216 Cr (Micro Cap)
30.00
52
0.00%
0.30
11.22%
3.30
Total Returns (Price + Dividend) 
Latest dividend: 0.5 per share ex-dividend date: Aug-19-2019
Risk Adjusted Returns v/s
Returns Beta

News

Sonam Ltd is Rated Buy by MarketsMOJO
Sonam Ltd is rated Buy by MarketsMOJO, with this rating last updated on 20 May 2026. However, the analysis and financial metrics discussed here reflect the stock’s current position as of 11 June 2026, providing investors with the latest insights into its performance and outlook.
Read full news article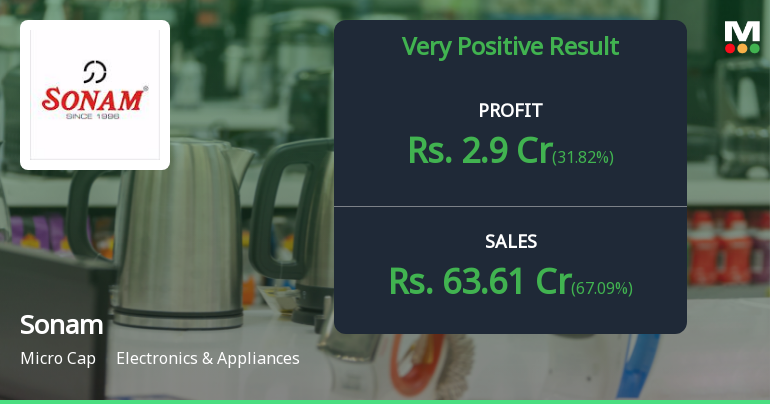
Sonam Ltd Q4 FY26: Explosive Growth Masks Margin Pressure as Stock Retreats from Highs
Sonam Limited, a micro-cap electronics and appliances manufacturer with a market capitalisation of ₹220.00 crores, delivered a remarkable top-line performance in Q4 FY26, with net sales surging 101.30% year-on-year to ₹63.61 crores. However, the stellar revenue growth came with a caveat—operating margins contracted sharply, and net profit growth of 70.59% year-on-year to ₹2.90 crores failed to match the pace of sales expansion. The stock has retreated 1.85% following the results, trading at ₹54.69, approximately 13% below its 52-week high of ₹63.00, as investors digest the margin compression concerns despite the impressive volume growth.
Read full news article
Sonam Ltd is Rated Buy by MarketsMOJO
Sonam Ltd is rated 'Buy' by MarketsMOJO, with this rating last updated on 20 May 2026. However, the analysis and financial metrics discussed here reflect the stock's current position as of 29 May 2026, providing investors with the most up-to-date view of the company’s performance and outlook.
Read full news article Announcements
Sonam Clock Limited - Clarification - Financial Results
18-Nov-2019 | Source : NSESonam Clock Limitedk Limited for the quarter ended 30-Sep-2019 with respect to Regulation 33 of the SEBI (Listing Obligations and Disclosure Requirements) Regulations, 2015.
Sonam Clock Limited - Outcome of Board Meeting
14-Nov-2019 | Source : NSESonam Clock Limited has informed the Exchange regarding Board meeting held on November 13, 2019. Declaration of Financial results for the half year ended as on 30/09/2019
Sonam Clock Limited - Statement of deviation(s) or variation(s) under Reg. 32
22-Oct-2019 | Source : NSESonam Clock Limited has informed the Exchange regarding Statement of deviation(s) or variation(s) under Reg. 32 of SEBI (LODR) Regulations 2015
Corporate Actions

No Upcoming Board Meetings

Sonam Ltd has declared 5% dividend, ex-date: 19 Aug 19

Sonam Ltd has announced 5:10 stock split, ex-date: 10 May 24

Sonam Ltd has announced 1:1 bonus issue, ex-date: 14 Jul 22

No Rights history available
Quality key factors
Valuation key factors
Technicals key factors
 Technical Indicator Scale: Bearish, Mildly Bearish, Sideways, Mildly Bullish, Bullish Turned
 Shareholding Snapshot : Mar 2026
Shareholding Compare (%holding)
Promoters
3.6492
Held by 0 Schemes
Held by 1 FIIs (0.26%)
Jayeshbhai Chhabildas Shah (52.86%)
Arcadia Share And Stock Brokers Pvt Ltd-proprietary A/c (4.05%)
32.29%
Quarterly Results Snapshot (Standalone) - Mar'26 - QoQ

QoQ Growth in quarter ended Mar 2026 is 67.09% vs 21.71% in Dec 2025

QoQ Growth in quarter ended Mar 2026 is 31.82% vs 144.44% in Dec 2025
Half Yearly Results Snapshot (Standalone) - Sep'25
Growth in half year ended Sep 2025 is 46.92% vs 12.62% in Sep 2024
Growth in half year ended Sep 2025 is -11.90% vs 29.23% in Sep 2024
Nine Monthly Results Snapshot (Standalone) - Dec'25
YoY Growth in nine months ended Dec 2025 is 48.39% vs 10.97% in Dec 2024
YoY Growth in nine months ended Dec 2025 is -4.74% vs 20.83% in Dec 2024
Annual Results Snapshot (Standalone) - Mar'26
YoY Growth in year ended Mar 2026 is 64.49% vs 18.94% in Mar 2025
YoY Growth in year ended Mar 2026 is 15.64% vs 14.67% in Mar 2025
About Sonam Ltd

Company Coordinates


