
Compare Source Natural with Similar Stocks
Stock DNA
Pharmaceuticals & Biotechnology
INR 76 Cr (Micro Cap)
21.00
36
0.00%
0.22
13.16%
2.72
Total Returns (Price + Dividend) 
Source Natural for the last several years.
Risk Adjusted Returns v/s
Returns Beta

News
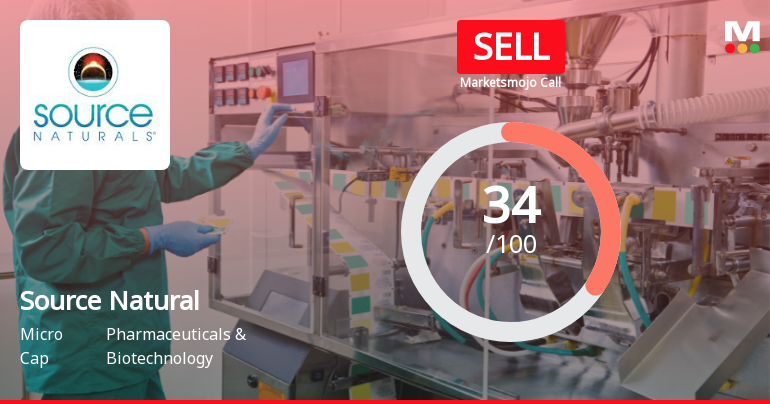
Source Natural Foods & Herbal Supplements Ltd Upgraded to Sell on Technical Improvements
Source Natural Foods & Herbal Supplements Ltd has seen its investment rating upgraded from Strong Sell to Sell, reflecting a nuanced shift in its technical outlook despite ongoing fundamental challenges. The change, effective from 14 July 2026, is driven primarily by improvements in technical indicators, while valuation and financial trends present a mixed picture for investors navigating the Pharmaceuticals & Biotechnology sector.
Read full news article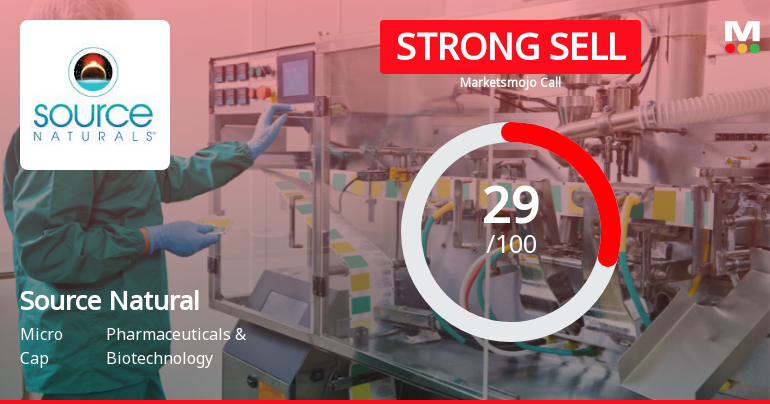
Source Natural Foods & Herbal Supplements Ltd Downgraded to Strong Sell Amid Technical Weakness and Mixed Fundamentals
Source Natural Foods & Herbal Supplements Ltd, a micro-cap player in the Pharmaceuticals & Biotechnology sector, has been downgraded from a Sell to a Strong Sell rating by MarketsMOJO as of 7 July 2026. This revision reflects a deterioration in technical indicators, persistent underperformance relative to benchmarks, and concerns over the company’s long-term financial trajectory despite recent quarterly gains.
Read full news article
Source Natural Foods & Herbal Supplements Ltd Upgraded to Sell on Technical Improvements
Source Natural Foods & Herbal Supplements Ltd has seen its investment rating upgraded from Strong Sell to Sell, reflecting a nuanced shift in its technical outlook despite ongoing fundamental challenges. The change, effective from 2 July 2026, is driven primarily by improvements in technical indicators, while valuation and financial trends present a mixed picture for investors in this micro-cap pharmaceutical and biotechnology company.
Read full news article Announcements
Compliances-Certificate under Reg. 74 (5) of SEBI (DP) Regulations 2018
10-Jul-2026 | Source : BSECertificate in terms of regulation 74(5) of SEBI (Depositories and Participants) Regulations 2018
Closure of Trading Window
30-Jun-2026 | Source : BSEClosure of Trading window for the quarter ended June 30 2026
Incorporation Of A Wholly Owned Subsidiary Company
19-Jun-2026 | Source : BSEApproval for incorporation of a Wholly Owned Subsidiary Company under the name Source Natural Estates Private Limited
Corporate Actions

No Upcoming Board Meetings

No Dividend history available

No Splits history available

No Bonus history available

No Rights history available
Quality key factors
Valuation key factors
Technicals key factors
 Technical Indicator Scale: Bearish, Mildly Bearish, Sideways, Mildly Bullish, Bullish Turned
 Shareholding Snapshot : Mar 2026
Shareholding Compare (%holding)
Promoters
None
Held by 0 Schemes
Held by 0 FIIs
Sriveda Sattva Private Limited (74.37%)
Guttikonda Vara Lakshmi (2.96%)
18.7%
Quarterly Results Snapshot (Standalone) - Mar'26 - QoQ

QoQ Growth in quarter ended Mar 2026 is 3.60% vs 19.76% in Dec 2025

QoQ Growth in quarter ended Mar 2026 is 51.22% vs 17.14% in Dec 2025
Half Yearly Results Snapshot (Standalone) - Sep'25
Growth in half year ended Sep 2025 is 57.79% vs 47.63% in Sep 2024
Growth in half year ended Sep 2025 is 5.56% vs 173.91% in Sep 2024
Nine Monthly Results Snapshot (Standalone) - Dec'25
YoY Growth in nine months ended Dec 2025 is 71.00% vs 40.99% in Dec 2024
YoY Growth in nine months ended Dec 2025 is -5.70% vs 60.56% in Dec 2024
Annual Results Snapshot (Standalone) - Mar'26
YoY Growth in year ended Mar 2026 is 56.68% vs 64.54% in Mar 2025
YoY Growth in year ended Mar 2026 is 17.24% vs 66.67% in Mar 2025
About Source Natural Foods & Herbal Supplements Ltd

Company Coordinates


