
Compare South Ind.Bank with Similar Stocks
Dashboard
Strong lending practices with low Gross NPA ratio of 1.43%
The Bank has a high Capital Adequacy Ratio of 16.47% signifying high buffers against its risk based assets
Healthy long term growth as Net profit has grown by an annual rate of 88.03%
Positive results in Mar 26
With ROA of 1, it has a Fair valuation with a 1.1 Price to Book Value
Total Returns (Price + Dividend) 
Latest dividend: 0.4 per share ex-dividend date: Aug-13-2025
Risk Adjusted Returns v/s
Returns Beta

News
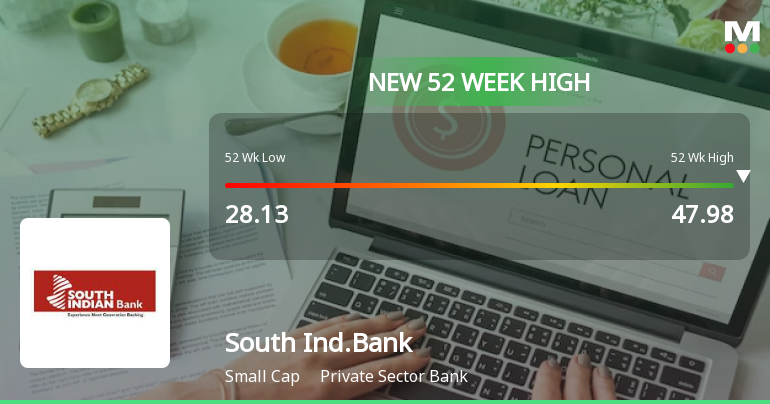
Broad-Based Technical Strength Lifts South Indian Bank Ltd to 52-Week High of Rs 48.15
With a surge to Rs 48.15 on 15 Jun 2026, South Indian Bank Ltd has reached a fresh 52-week and all-time high, marking a remarkable 59.85% gain over the past year. This rally is underpinned by a confluence of strong technical indicators and sustained price momentum, setting the stage for a notable milestone in the bank’s market journey.
Read full news article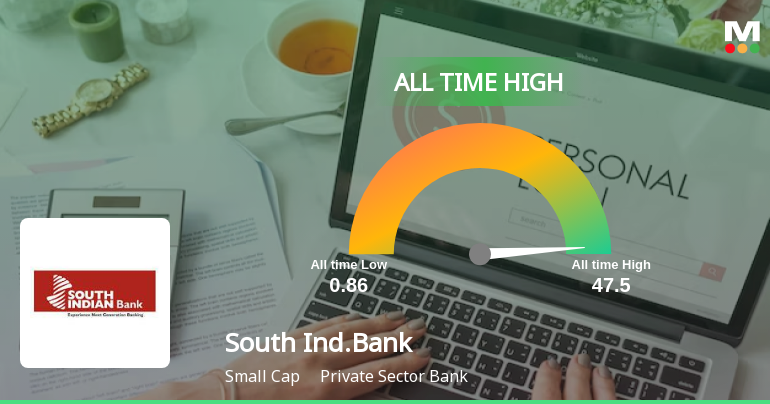
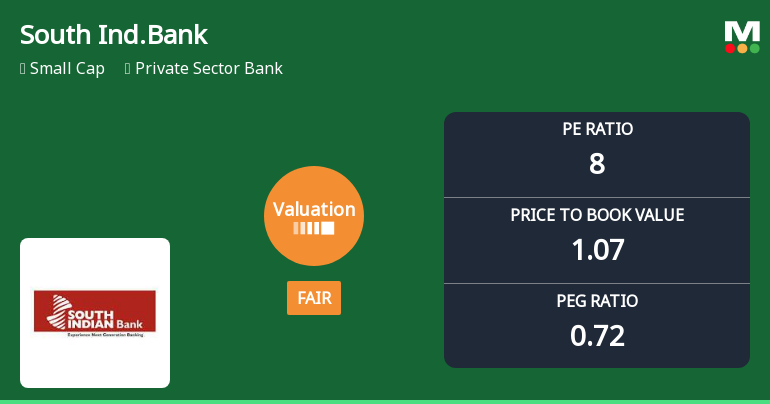
South Indian Bank Ltd Valuation Shifts: From Attractive to Fair Amid Strong Returns
South Indian Bank Ltd, a small-cap player in the private sector banking space, has witnessed a notable shift in its valuation parameters, moving from an attractive to a fair valuation grade. Despite this, the bank continues to deliver robust returns, outperforming the Sensex significantly over multiple time horizons. This article analyses the recent changes in key valuation metrics, compares them with peer averages, and assesses the implications for investors.
Read full news article Announcements
Compliances-Reg.24(A)-Annual Secretarial Compliance
29-May-2026 | Source : BSEAnnual Secretarial Compliance Report for the Financial year ended March 31 2026
Announcement under Regulation 30 (LODR)-Allotment of ESOP / ESPS
22-May-2026 | Source : BSEIntimation under Regulation 30 of SEBI (LODR) Regulations 2015- Allotment of Equity shares under SIB ESOS Scheme -2008
Intimation Under Regulation 30 Of The SEBI (Listing Obligations And Disclosure Requirements) Regulations 2015
22-May-2026 | Source : BSEIntimation under Regulation 30 of the SEBI (LODR) Regulations 2015
Corporate Actions

No Upcoming Board Meetings

South Indian Bank Ltd has declared 40% dividend, ex-date: 13 Aug 25

South Indian Bank Ltd has announced 1:10 stock split, ex-date: 23 Sep 10

South Indian Bank Ltd has announced 1:4 bonus issue, ex-date: 16 Oct 08

South Indian Bank Ltd has announced 1:4 rights issue, ex-date: 27 Feb 24
Quality key factors
Valuation key factors
Technicals key factors
 Technical Indicator Scale: Bearish, Mildly Bearish, Sideways, Mildly Bullish, Bullish Turned
 Shareholding Snapshot : Mar 2026
Shareholding Compare (%holding)
Non Institution
None
Held by 10 Schemes (11.29%)
Held by 233 FIIs (24.21%)
None
Bandhan Small Cap Fund (4.75%)
49.47%
Quarterly Results Snapshot (Standalone) - Mar'26 - QoQ

QoQ Growth in quarter ended Mar 2026 is 1.67% vs 4.59% in Dec 2025

QoQ Growth in quarter ended Mar 2026 is 8.86% vs 6.53% in Dec 2025
Half Yearly Results Snapshot (Standalone) - Sep'25
Growth in half year ended Sep 2025 is 2.15% vs 12.4% in Sep 2024
Growth in half year ended Sep 2025 is 8.81% vs 29.69% in Sep 2024
Nine Monthly Results Snapshot (Standalone) - Dec'25
YoY Growth in nine months ended Dec 2025 is 3.51% vs 11.07% in Dec 2024
YoY Growth in nine months ended Dec 2025 is 9.05% vs 22.77% in Dec 2024
Annual Results Snapshot (Standalone) - Mar'26
YoY Growth in year ended Mar 2026 is 4.6% vs 9.29% in Mar 2025
YoY Growth in year ended Mar 2026 is 11.69% vs 21.76% in Mar 2025
About South Indian Bank Ltd

Company Coordinates


