
Compare South West Pinn. with Similar Stocks
Dashboard
With a growth in Net Profit of 34.22%, the company declared Very Positive results in Mar 26
- The company has declared positive results for the last 6 consecutive quarters
- ROCE(HY) Highest at 18.32%
- INVENTORY TURNOVER RATIO(HY) Highest at 4.77 times
- OPERATING PROFIT TO INTEREST(Q) Highest at 9.57 times
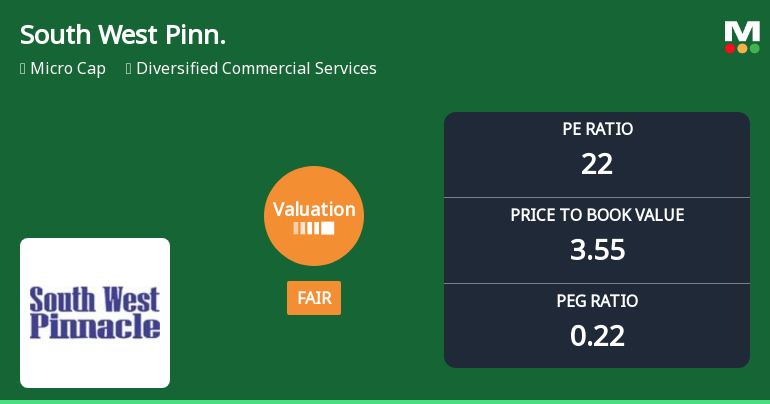
With ROCE of 17.2, it has a Fair valuation with a 2.9 Enterprise value to Capital Employed
Market Beating Performance
Stock DNA
Diversified Commercial Services
INR 718 Cr (Micro Cap)
22.00
34
0.00%
0.34
16.23%
3.55
Total Returns (Price + Dividend) 
Latest dividend: 0.5 per share ex-dividend date: Sep-20-2024
Risk Adjusted Returns v/s
Returns Beta

News
South West Pinnacle Exploration Ltd: Valuation Shifts Signal Renewed Price Attractiveness
South West Pinnacle Exploration Ltd has undergone a notable shift in its valuation parameters, moving from an expensive to a fair valuation grade. This change, coupled with its robust financial metrics and relative performance against peers and the broader market, highlights a renewed price attractiveness for investors seeking exposure in the diversified commercial services sector.
Read full news article
South West Pinnacle Exploration Ltd Upgraded to Buy on Strong Financial and Technical Signals
South West Pinnacle Exploration Ltd has been upgraded from a Hold to a Buy rating following a comprehensive reassessment of its quality, valuation, financial trends, and technical indicators. The micro-cap stock’s recent surge in profitability, robust technical signals, and market-beating returns have collectively driven this positive revision, signalling renewed investor confidence in the company’s growth prospects.
Read full news article
South West Pinnacle Exploration Ltd Technical Momentum Shifts Signal Bullish Outlook
South West Pinnacle Exploration Ltd has demonstrated a marked shift in price momentum, supported by a series of bullish technical signals that have upgraded its outlook from mildly bullish to outright bullish. The stock’s recent performance, combined with positive technical indicators such as MACD and moving averages, suggests a strengthening trend that investors should closely monitor.
Read full news article Announcements
Updates
04-Jun-2026 | Source : BSEEmpanelment by Oil India Limited for Seismic Data Acquisition Services
Announcement under Regulation 30 (LODR)-Award_of_Order_Receipt_of_Order
04-Jun-2026 | Source : BSEAnnouncement for receipt of Letter of Award/Work Orders
Announcement under Regulation 30 (LODR)-Memorandum of Understanding /Agreements
29-May-2026 | Source : BSEDisclosure under Regulation 30 of SEBI ( Listing Obligation and Disclosure Requirement) Regulations 2015.
Corporate Actions

No Upcoming Board Meetings

South West Pinnacle Exploration Ltd has declared 5% dividend, ex-date: 20 Sep 24

No Splits history available

South West Pinnacle Exploration Ltd has announced 1:1 bonus issue, ex-date: 04 Apr 19

No Rights history available
Quality key factors
Valuation key factors
Technicals key factors
 Technical Indicator Scale: Bearish, Mildly Bearish, Sideways, Mildly Bullish, Bullish Turned
 Shareholding Snapshot : Mar 2026
Shareholding Compare (%holding)
Promoters
None
Held by 0 Schemes
Held by 4 FIIs (0.76%)
Vikas Jain (39.62%)
Ajay Kumar Aggarwal (2.01%)
25.43%
Quarterly Results Snapshot (Consolidated) - Mar'26 - YoY

YoY Growth in quarter ended Mar 2026 is 5.23% vs 64.05% in Mar 2025
YoY Growth in quarter ended Mar 2026 is 30.63% vs 256.79% in Mar 2025
Half Yearly Results Snapshot (Consolidated) - Sep'25

Growth in half year ended Sep 2025 is 80.77% vs 22.76% in Sep 2024
Growth in half year ended Sep 2025 is 374.01% vs 78.74% in Sep 2024
Nine Monthly Results Snapshot (Consolidated) - Dec'25
YoY Growth in nine months ended Dec 2025 is 56.96% vs 19.14% in Dec 2024
YoY Growth in nine months ended Dec 2025 is 210.73% vs 17.55% in Dec 2024
Annual Results Snapshot (Consolidated) - Mar'26
YoY Growth in year ended Mar 2026 is 34.79% vs 35.14% in Mar 2025
YoY Growth in year ended Mar 2026 is 101.03% vs 98.67% in Mar 2025
About South West Pinnacle Exploration Ltd

Company Coordinates


