
Compare Sover. Diamonds with Similar Stocks
Dashboard
With a Operating Losses, the company has a Weak Long Term Fundamental Strength
- Low ability to service debt as the company has a high Debt to EBITDA ratio of 4.01 times
- The company has been able to generate a Return on Equity (avg) of 5.32% signifying low profitability per unit of shareholders funds
Flat results in Mar 26
Risky - Negative EBITDA
Underperformed the market in the last 1 year
Stock DNA
Gems, Jewellery And Watches
INR 13 Cr (Micro Cap)
NA (Loss Making)
48
0.00%
-0.09
-37.66%
1.04
Total Returns (Price + Dividend) 
Sover. Diamonds for the last several years.
Risk Adjusted Returns v/s
Returns Beta

News
Are Sovereign Diamonds Ltd latest results good or bad?
Sovereign Diamonds Ltd's latest financial results for Q4 FY26 reveal significant operational challenges and a concerning trajectory. The company reported net sales of ₹2.11 crores, reflecting a year-on-year decline of 46.04% and a sequential drop of 25.44% from the previous quarter. This revenue compression indicates a structural issue rather than a temporary setback, as the company has struggled to maintain consistent revenue generation over recent periods. The operating margin turned sharply negative at -9.0%, a stark contrast to the positive margin of 9.21% recorded in the same quarter last year. This reversal highlights the company's inability to cover its operating expenses from sales revenue, suggesting fundamental challenges in its business model. Additionally, the net loss for the quarter stood at ₹0.32 crores, marking a significant deterioration compared to the previous year's performance. The co...
Read full news article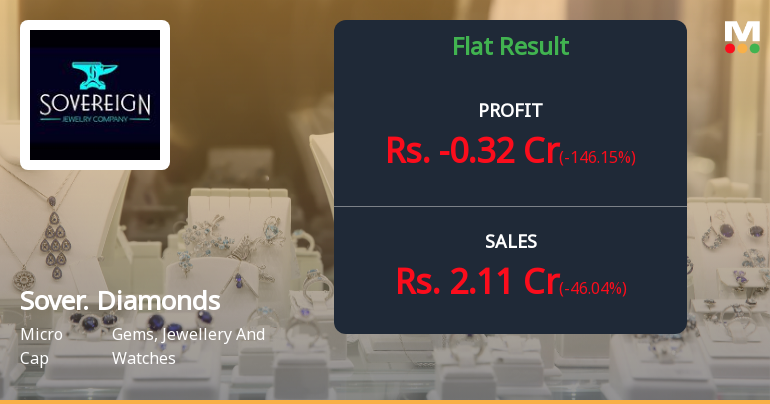
Sovereign Diamonds Q4 FY26: Mounting Losses Deepen as Revenue Plummets 46%
Sovereign Diamonds Ltd., a Mumbai-based manufacturer and exporter of diamond jewellery, reported a dismal fourth quarter for FY26, posting a net loss of ₹0.32 crores compared to a loss of ₹0.13 crores in Q4 FY25. The company's revenue collapsed 46.04% year-on-year to ₹2.11 crores, whilst sequentially declining 25.44% from Q3 FY26's ₹2.83 crores. The micro-cap company, with a market capitalisation of just ₹13.00 crores, saw its shares close at ₹21.83 on June 02, 2026, down 2.41% on the day and trading 45.43% below its 52-week high of ₹40.00.
Read full news article Announcements
Audited Annual Financial Results For The Financial Year Ended 31-Mar-2026
29-May-2026 | Source : BSEEnclosed is the Audited Annual Financial Results for the financial year ended 31-Mar-2026
Announcement under Regulation 30 (LODR)-Change in Management
29-May-2026 | Source : BSEOutcome of Board Meeting
Board Meeting Outcome for Outcome Of Board Meeting
29-May-2026 | Source : BSEOutcome of Board Meeting
Corporate Actions

No Upcoming Board Meetings

No Dividend history available

No Splits history available

No Bonus history available

No Rights history available
Quality key factors
Valuation key factors
Technicals key factors
 Technical Indicator Scale: Bearish, Mildly Bearish, Sideways, Mildly Bullish, Bullish Turned
 Shareholding Snapshot : Mar 2026
Shareholding Compare (%holding)
Promoters
None
Held by 0 Schemes
Held by 0 FIIs
Ajay Ramesh Gehani (60.06%)
Nagarjuna Finance Ltd (1.58%)
30.84%
Quarterly Results Snapshot (Standalone) - Mar'26 - YoY

YoY Growth in quarter ended Mar 2026 is -46.04% vs -49.29% in Mar 2025

YoY Growth in quarter ended Mar 2026 is -146.15% vs -139.39% in Mar 2025
Half Yearly Results Snapshot (Standalone) - Sep'25
Growth in half year ended Sep 2025 is -7.40% vs -19.18% in Sep 2024
Growth in half year ended Sep 2025 is -7,816.67% vs -110.00% in Sep 2024
Nine Monthly Results Snapshot (Standalone) - Dec'25
YoY Growth in nine months ended Dec 2025 is -44.14% vs 10.47% in Dec 2024
YoY Growth in nine months ended Dec 2025 is -10,975.00% vs -96.19% in Dec 2024
Annual Results Snapshot (Standalone) - Mar'26
YoY Growth in year ended Mar 2026 is -29.49% vs -26.28% in Mar 2025
YoY Growth in year ended Mar 2026 is -46,800.00% vs -99.28% in Mar 2025
About Sovereign Diamonds Ltd

Company Coordinates


