
Compare Spacenet Enterpr with Similar Stocks
Total Returns (Price + Dividend) 
Latest dividend: 0.01 per share ex-dividend date: Jun-05-2026
Risk Adjusted Returns v/s
Returns Beta

News

Spacenet Enterprises India Ltd Reports Positive Financial Trend Amidst Challenging Market Returns
Spacenet Enterprises India Ltd has demonstrated a notable turnaround in its financial performance for the quarter ended March 2026, shifting from a flat to a positive growth trajectory. Despite ongoing market headwinds and a challenging valuation environment, the company’s latest quarterly results reveal significant improvements in profitability and operational efficiency, signalling a potential inflection point for this micro-cap player in the miscellaneous sector.
Read full news article
Spacenet Enterprises India Ltd is Rated Sell
Spacenet Enterprises India Ltd is rated Sell by MarketsMOJO, with this rating last updated on 14 Jan 2026. However, the analysis and financial metrics discussed here reflect the stock’s current position as of 31 May 2026, providing investors with an up-to-date view of the company’s fundamentals, returns, and market performance.
Read full news article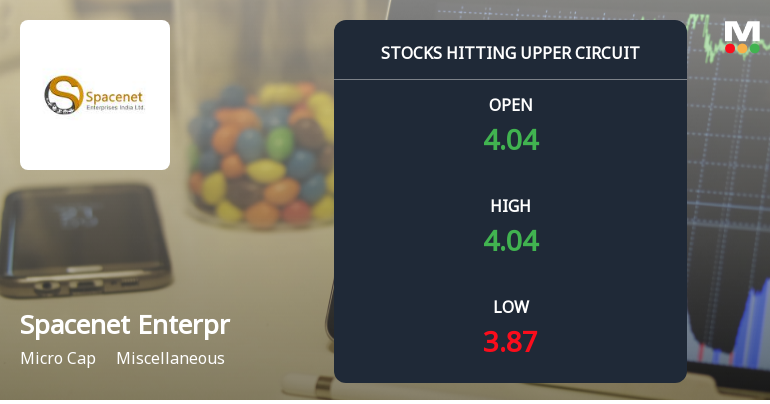
Spacenet Enterprises India Ltd Locks at Upper Circuit With 3.64% Gain — Buyers Queue, Sellers Absent
At Rs 4.04, the buying was done — not because demand dried up, but because the exchange wouldn't let the stock go any higher. Spacenet Enterprises India Ltd locked at its upper circuit of 3.64% on 25 May 2026, with buyers queuing and no sellers willing to part with shares.
Read full news article Announcements
Spacenet Enterprises India Limited - Other General Purpose
09-Dec-2019 | Source : NSESpacenet Enterprises India Limited has informed the Exchange that Pursuant to Regulation 23(9) of SEBI (Listing Obligations and Disclosure Requirements) as amended from time to time, the Company has submitted a copy of Related Party Transactions, prepare in accordance with applicable Accounting Standards.
Spacenet Enterprises India Limited - Clarification - Financial Results
18-Nov-2019 | Source : NSESpacenet Enterprises India Limitedrprises India Limited for the quarter ended 30-Sep-2019 with respect to Regulation 33 of the SEBI (Listing Obligations and Disclosure Requirements) Regulations, 2015.
Spacenet Enterprises India Limited - Outcome of Board Meeting
14-Nov-2019 | Source : NSESpacenet Enterprises India Limited has informed the Exchange regarding Board meeting held on November 13, 2019.
Corporate Actions

No Upcoming Board Meetings

Spacenet Enterprises India Ltd has declared 1% dividend, ex-date: 05 Jun 26

No Splits history available

No Bonus history available

No Rights history available
Quality key factors
Valuation key factors
Technicals key factors
 Technical Indicator Scale: Bearish, Mildly Bearish, Sideways, Mildly Bullish, Bullish Turned
 Shareholding Snapshot : Mar 2026
Shareholding Compare (%holding)
Non Institution
None
Held by 0 Schemes
Held by 4 FIIs (1.65%)
Sri Matha Meenavalli (7.3%)
Matis Enterprise Private Limited (22.44%)
39.0%
Quarterly Results Snapshot (Consolidated) - Mar'26 - QoQ

QoQ Growth in quarter ended Mar 2026 is -4.98% vs -1.63% in Dec 2025

QoQ Growth in quarter ended Mar 2026 is 68.84% vs -43.09% in Dec 2025
Half Yearly Results Snapshot (Consolidated) - Sep'25
Growth in half year ended Sep 2025 is 28.08% vs 55.99% in Sep 2024
Growth in half year ended Sep 2025 is 44.24% vs 14.97% in Sep 2024
Nine Monthly Results Snapshot (Consolidated) - Dec'25
YoY Growth in nine months ended Dec 2025 is 26.30% vs 47.00% in Dec 2024
YoY Growth in nine months ended Dec 2025 is 55.95% vs -16.27% in Dec 2024
Annual Results Snapshot (Consolidated) - Mar'26
YoY Growth in year ended Mar 2026 is 23.98% vs 22.49% in Mar 2025
YoY Growth in year ended Mar 2026 is 35.16% vs 13.89% in Mar 2025
About Spacenet Enterprises India Ltd

Company Coordinates


