
Compare Sparkle GoldRock with Similar Stocks
Stock DNA
Garments & Apparels
INR 29 Cr (Micro Cap)
7.00
52
0.00%
2.84
84.30%
5.58
Total Returns (Price + Dividend) 
Sparkle GoldRock for the last several years.
Risk Adjusted Returns v/s
Returns Beta

News
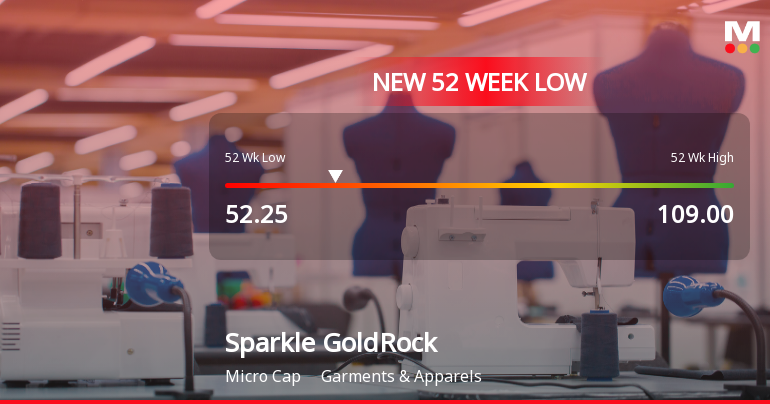
Sparkle Gold Rock Ltd Falls to 52-Week Low of Rs 52.25 as Sell-Off Deepens
For the second consecutive session, Sparkle Gold Rock Ltd has extended its decline, hitting a fresh 52-week low of Rs 52.25 on 13 Jul 2026, marking a 2.58% drop over the last two days amid broader market weakness.
Read full news article
Sparkle Gold Rock Ltd is Rated Sell
Sparkle Gold Rock Ltd is rated 'Sell' by MarketsMOJO, with this rating last updated on 31 January 2026. However, the analysis and financial metrics presented here reflect the company’s current position as of 09 July 2026, providing investors with an up-to-date view of the stock’s fundamentals, returns, and technical outlook.
Read full news article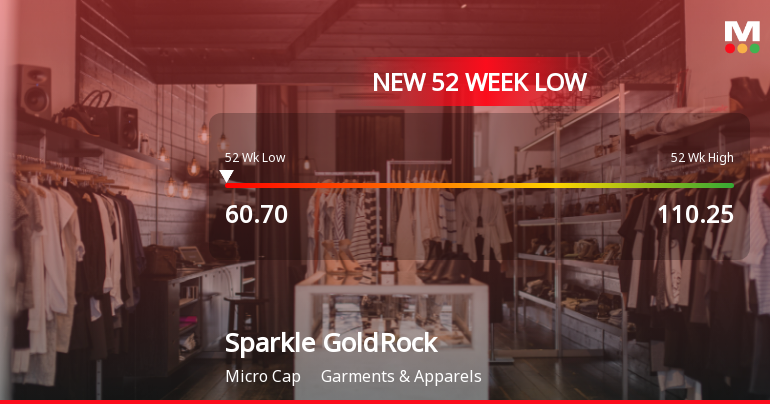
Sparkle Gold Rock Ltd Falls to 52-Week Low of Rs 60.7 as Sell-Off Deepens
A sharp decline over the past three sessions has dragged Sparkle Gold Rock Ltd to a fresh 52-week low of Rs 60.7 on 8 Jul 2026, marking a 42.19% drop over the last year despite the company’s improving financial performance.
Read full news article Announcements
Compliances-Certificate under Reg. 74 (5) of SEBI (DP) Regulations 2018
09-Jul-2026 | Source : BSECertificate under reg 74(5) of SEBI (DP) regulation 2018 for the quarter ended 30th June 2026
Closure of Trading Window
26-Jun-2026 | Source : BSEClosure of Trading window for the quarter ending 30th June 2026
Complete Financials Results For Year Ended 31 March 2026.
13-Jun-2026 | Source : BSEComplete Financials Results for year ended 31 March 2026.
Corporate Actions

No Upcoming Board Meetings

No Dividend history available

No Splits history available

No Bonus history available

No Rights history available
Quality key factors
Valuation key factors
Technicals key factors
 Technical Indicator Scale: Bearish, Mildly Bearish, Sideways, Mildly Bullish, Bullish Turned
 Shareholding Snapshot : Jun 2026
Shareholding Compare (%holding)
Non Institution
None
Held by 2 Schemes (0.87%)
Held by 0 FIIs
None
Sarita Devi Sharma (8.34%)
55.82%
Quarterly Results Snapshot (Standalone) - Mar'26 - YoY

YoY Growth in quarter ended Mar 2026 is 654.91% vs 0.00% in Mar 2025
YoY Growth in quarter ended Mar 2026 is 2,200.00% vs -250.00% in Mar 2025
Half Yearly Results Snapshot (Standalone) - Sep'25
Growth in half year ended Sep 2025 is 0.00% vs 0.00% in Sep 2024
Growth in half year ended Sep 2025 is 766.67% vs 71.43% in Sep 2024
Nine Monthly Results Snapshot (Standalone) - Dec'25
YoY Growth in nine months ended Dec 2025 is 2,568.86% vs 0.00% in Dec 2024
YoY Growth in nine months ended Dec 2025 is 1,200.00% vs -103.40% in Dec 2024
Annual Results Snapshot (Standalone) - Mar'26
YoY Growth in year ended Mar 2026 is 1,139.67% vs 0.00% in Mar 2025
YoY Growth in year ended Mar 2026 is 1,760.00% vs -107.79% in Mar 2025
About Sparkle Gold Rock Ltd

Company Coordinates


