
 Price Point
Compare Spel Semiconduct with Similar Stocks
ScoreDashboard
With HIgh Debt (Debt-Equity Ratio at 6.85 times)- the company has a Weak Long Term Fundamental Strength
- Low ability to service debt as the company has a high Debt to EBITDA ratio of -19.51 times
- The company has been able to generate a Return on Equity (avg) of 3.38% signifying low profitability per unit of shareholders funds
Flat results in Mar 26
Risky - Negative EBITDA
Despite the size of the company, domestic mutual funds hold only 0.05% of the company
Mojo ParametersStock DNA

Other Electrical Equipment

INR 719 Cr (Micro Cap)

NA (Loss Making)
39

0.00%

6.85

-164.92%

236.86
Total ReturnsTotal Returns (Price + Dividend) 
Spel Semiconduct for the last several years.
Risk Adjusted Returns v/s
Returns Beta
 News & Corporate Actions
News
Spel Semiconductor Ltd Technical Momentum Shifts Amid Mixed Indicator Signals
Spel Semiconductor Ltd, a micro-cap player in the Other Electrical Equipment sector, has exhibited a notable shift in price momentum and technical indicators, reflecting a complex market stance. Despite a 3.19% gain on 28 Jul 2026, the company’s technical parameters reveal a blend of bullish and bearish signals, prompting a cautious outlook from analysts and investors alike.
Read full news article
Spel Semiconductor Ltd Faces Mixed Technical Signals Amid Mildly Bearish Momentum
Spel Semiconductor Ltd, a micro-cap player in the Other Electrical Equipment sector, is currently navigating a complex technical landscape marked by a shift from sideways to mildly bearish momentum. Despite a recent downgrade to a Strong Sell rating, the stock exhibits a blend of bullish and bearish technical indicators, reflecting a nuanced market sentiment as it trades near ₹152.35, down 2.40% on the day.
Read full news article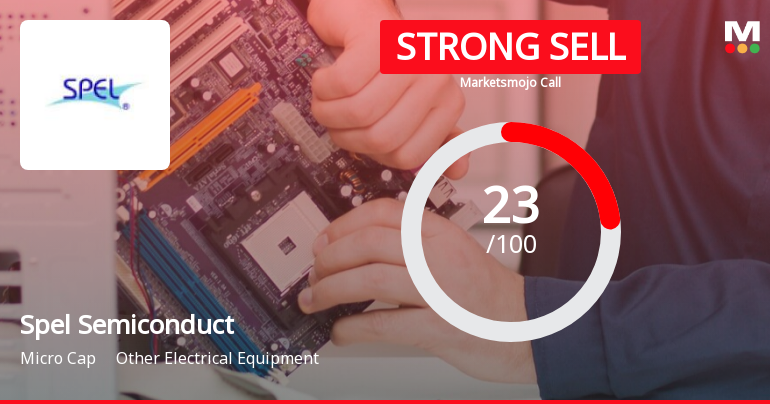
Spel Semiconductor Ltd is Rated Strong Sell
Spel Semiconductor Ltd is rated Strong Sell by MarketsMOJO, with this rating last updated on 11 Dec 2025. However, the analysis and financial metrics discussed here reflect the stock’s current position as of 23 July 2026, providing investors with an up-to-date view of the company’s fundamentals, valuation, financial trends, and technical outlook.
Read full news article Announcements
Board Meeting Intimation for Consideration And Approval Of Tripartite Strategic Memorandum Of Understanding Signing With M/S Calsoft Chennai And M/S Natronix - India Chennai
27-Jul-2026 | Source : BSESPEL Semiconductor Ltdhas informed BSE that the meeting of the Board of Directors of the Company is scheduled on 29/07/2026 inter alia to consider and approve Tripartite Strategic Memorandum of Understanding signing with M/s Calsoft Chennai and M/s Natronix - India Chennai
Compliances-Certificate under Reg. 74 (5) of SEBI (DP) Regulations 2018
24-Jul-2026 | Source : BSECertificate under Reg 74 (5) of the SEBI (DP) Regulations 2018 for the period ended 30.06.2026
Board Meeting Outcome for Outcome Of The Meeting Of The Board Of Directors Of The Company Held On 20Th July 2026.
20-Jul-2026 | Source : BSEOutcome of the Meeting of the Board of Directors of the Company held on 20th July 2026.
Corporate Actions

No Upcoming Board Meetings

No Dividend history available

No Splits history available

No Bonus history available

No Rights history available
Key FactorsQuality key factors
Valuation key factors
Technicals key factors
 Technical Indicator Scale: Bearish, Mildly Bearish, Sideways, Mildly Bullish, Bullish Turned Shareholding
Shareholding Snapshot : Mar 2026
Shareholding Compare (%holding)
Promoters
None
Held by 2 Schemes (0.02%)
Held by 1 FIIs (0.02%)
Natronix Semiconductor Technology Private Limited (55.97%)
Hitesh Ramji Jhaveri (1.84%)
38.19%
FinancialQuarterly Results Snapshot (Standalone) - Mar'26 - QoQ
 Compare with Peers
QoQ Growth in quarter ended Mar 2026 is 246.03% vs -58.82% in Dec 2025
QoQ Growth in quarter ended Mar 2026 is 111.74% vs 47.39% in Dec 2025

Half Yearly Results Snapshot (Standalone) - Sep'25
Growth in half year ended Sep 2025 is -1.98% vs -51.91% in Sep 2024

Growth in half year ended Sep 2025 is -119.32% vs -5.92% in Sep 2024
Nine Monthly Results Snapshot (Standalone) - Dec'25
YoY Growth in nine months ended Dec 2025 is -24.54% vs -43.66% in Dec 2024
YoY Growth in nine months ended Dec 2025 is -88.58% vs -8.48% in Dec 2024
Annual Results Snapshot (Standalone) - Mar'26
YoY Growth in year ended Mar 2026 is -20.10% vs -34.50% in Mar 2025
YoY Growth in year ended Mar 2026 is -13.25% vs -25.37% in Mar 2025
 Company CV
About Spel Semiconductor Ltd

Company Coordinates










