Spel Semiconduct

  • Market Cap: Micro Cap
  • Industry: Other Electrical Equipment
  • ISIN: INE252A01019
  • NSEID: SPELS
  • BSEID: 517166
INR
148.68
-1.08 (-0.72%)
BSENSE

Sep 02, 03:30 PM

BSE+NSE Vol: 6702

  • Price Points
  • Score
  • Mojo Parameters
  • Total Return
  • News and Corporate Actions
  • Key factors
  • Shareholding
  • Financials
  • CompanyCV
stock-summaryPrice Point
High/Low

1Day

52 Week

Valuation
Technical
Day's Volume

CASH

6.7 k (-77.26%) Volume

Shareholding (Jun 2026)

FII

0.02%

Held by 1 FIIs

DII

0.02%

Held by 0 DIIs

Promoter

59.17%

Why is Spel Semiconductor Ltd falling/rising?

03-Sep-2026

As of 02-Sep, Spel Semiconductor Ltd's stock price is rising to 148.75, reflecting a 0.3% increase and a 3.77% gain over the past week. However, it has underperformed its sector today and shows decreased investor participation, indicating mixed signals for its longer-term performance.

As of 02-Sep, Spel Semiconductor Ltd's stock price is rising, currently at 148.75, with a change of 0.45 (0.3%) upward. The stock has shown a positive performance over the last week, gaining 3.77%, while the benchmark Sensex has declined by 1.17%. Additionally, the stock has experienced consecutive gains over the past two days, with a total increase of 1.09% during this period.<BR><BR>Despite this upward movement, it is important to note that the stock has underperformed its sector by 2.3% today, and its delivery volume has significantly decreased by 39.01% compared to the 5-day average, indicating a potential decline in investor participation. Furthermore, while the stock is currently above its 5-day moving average, it remains below the longer-term moving averages (20-day, 50-day, 100-day, and 200-day), suggesting mixed signals regarding its longer-term performance.<BR><BR>Overall, the recent rise in Spel Semiconductor Ltd's stock price can be attributed to its short-term gains and positive weekly performance, despite some concerning indicators regarding sector performance and investor engagement.

View full answer

Who are in the management team of Spel Semiconduct?

01-Sep-2026

The management team of Spel Semiconduct includes K Ravi Kumar, S Chandramohan, and Enakshi Bhattacharya as Independent Non-Executive Directors, M Jayasankar and E. Nakkeeran as Non-Executive Directors, and P. Balamurugan and D Balakrishnan as Executive Directors. This diverse board provides governance and strategic direction for the company.

The management team of Spel Semiconduct includes the following members:<BR><BR>1. **K Ravi Kumar** - Independent Non-Executive Director<BR>2. **S Chandramohan** - Independent Non-Executive Director<BR>3. **Enakshi Bhattacharya** - Independent Non-Executive Director<BR>4. **M Jayasankar** - Non-Executive & Non-Independent Director<BR>5. **P. Balamurugan** - Executive Director & Whole-time Director<BR>6. **D Balakrishnan** - Executive Director / Whole-time Director<BR>7. **E. Nakkeeran** - Non-Executive & Non-Independent Director<BR><BR>This diverse board includes both independent and executive directors, contributing to the governance and strategic direction of the company.

View full answer

What does Spel Semiconduct do?

01-Sep-2026

Spel Semiconductor Ltd is a micro-cap company in the Other Electrical Equipment industry, specializing in manufacturing electronic products like integrated circuits. As of June 2026, it reported net sales of 0 Cr and a net profit of -1 Cr, with a market cap of INR 699 Cr.

Overview:<BR>Spel Semiconductor Ltd is a micro-cap company operating in the Other Electrical Equipment industry, primarily engaged in the manufacture of electronic products such as computer tapes, diskettes, jumbo rolls, and integrated circuits.<BR><BR>History:<BR>Spel Semiconductor Ltd was incorporated as a Private Company in December 1984 and later converted into a Public Company in March 1986. The company went public in August 1988 to partially finance a sophisticated electronic project. The latest quarterly results reported net sales and net profit for June 2026.<BR><BR>Financial Snapshot:<BR>Most recent Net Sales: 0 Cr (Quarterly Results - Jun 2026) <BR>Most recent Net Profit: -1 Cr (Quarterly Results - Jun 2026) <BR>Market-cap value: INR 699 Cr (Micro Cap)<BR><BR>Key Metrics:<BR>P/E: N/A <BR>Industry P/E: 38 <BR>Dividend Yield: 0.00% <BR>Debt-Equity: 6.85 <BR>Return on Equity: -129.18% <BR>Price to Book: 229.45<BR><BR>Contact Details:<BR>Address: 5 CMDA Industrial Estate, Maraimalai Nagar Chennai Tamil Nadu : 603209 <BR>Tel: 91-044-47405300 <BR>Email: info@spel.com <BR>Website: http://www.spel.com

View full answer

Who are the peers of the Spel Semiconduct?

01-Sep-2026

Spel Semiconduct's peers include Prostarm Info, Solex Energy, Mangal Electrica, Permanent Magnet, GEE, Viviana Power, Supreme Power, and Australian Prem. Management risk varies from excellent at Solex Energy and Supreme Power to below average at Spel Semiconduct, with GEE showing the highest 1-year return at 55.10% and Mangal Electrica the lowest at -45.58%.

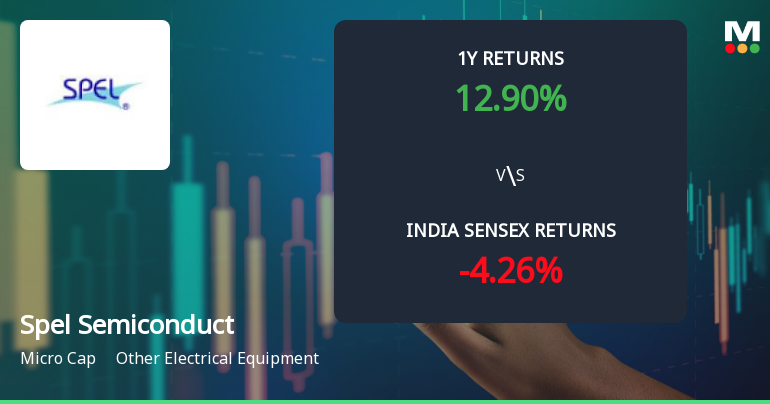
Peers: The peers of Spel Semiconduct are Prostarm Info, Solex Energy, Mangal Electrica, Permanent Magnet, GEE, Viviana Power, Supreme Power, and Australian Prem.<BR><BR>Quality Snapshot: Excellent management risk is observed at Solex Energy and Supreme Power, while Average management risk is found at Prostarm Info, Permanent Magnet, and Australian Prem. Below Average management risk is present at Spel Semiconduct, Mangal Electrica, GEE, and Viviana Power. Growth is Excellent at Solex Energy and Viviana Power, while Average growth is seen at Prostarm Info and Permanent Magnet, and Below Average growth is noted at Spel Semiconduct, Mangal Electrica, and GEE. Capital Structure is Excellent at Mangal Electrica and Australian Prem, Good at Prostarm Info and Permanent Magnet, Average at Solex Energy, and Below Average at Spel Semiconduct, GEE, and the rest.<BR><BR>Return Snapshot: GEE has the highest 1-year return at 55.10%, while Mangal Electrica has the lowest at -45.58%. Spel Semiconduct's 1-year return of 16.45% is higher than Mangal Electrica's but lower than GEE's. Additionally, Mangal Electrica and Permanent Magnet have negative six-month returns.

View full answer

Should I buy, sell or hold Spel Semiconductor Ltd?

01-Sep-2026

How big is Spel Semiconduct?

14-Aug-2026

Summary could not be generated.

As of 14th August, Spel Semiconductor Ltd has a market capitalization of 685.31 Cr, categorizing it as a Micro Cap company.<BR><BR>For the latest four quarters, Spel Semiconductor reported net sales of 48.05 Cr. However, the company experienced a loss of 0.13 Cr during the same period.<BR><BR>The reporting period for the balance sheet is the latest annual period. Unfortunately, data for Shareholder's Funds and Total Assets is unavailable.

View full answer

When is the next results date for Spel Semiconductor Ltd?

13-May-2026

The next results date for Spel Semiconductor Ltd is 19 May 2026.

The next results date for Spel Semiconductor Ltd is scheduled for 19 May 2026.

View full answer

Is Spel Semiconduct technically bullish or bearish?

28-Nov-2025

As of November 27, 2025, the trend has shifted to mildly bullish, supported by daily moving averages, though caution is advised due to bearish weekly MACD and RSI indicators, while monthly signals remain bullish for a stronger long-term outlook.

As of 27 November 2025, the technical trend has changed from mildly bearish to mildly bullish. The current stance is mildly bullish, supported by the daily moving averages indicating a bullish trend. However, the weekly MACD and RSI remain bearish, suggesting some caution. The monthly indicators, including MACD and Dow Theory, are bullish, providing a stronger long-term outlook. Overall, while there are mixed signals across different time frames, the shift to a mildly bullish trend indicates a potential for upward movement in the near term.

View full answer

How has been the historical performance of Spel Semiconduct?

27-Nov-2025

Spel Semiconduct has experienced significant declines in net sales and profitability from Mar'13 to Mar'17, with total operating income dropping from 91.46 Cr to 35.67 Cr and losses in profit before tax and profit after tax reported in recent years. The company's financial challenges are reflected in negative earnings per share, indicating ongoing difficulties in maintaining revenue growth.

Answer:<BR>The historical performance of Spel Semiconduct shows significant fluctuations in net sales and profitability over the years.<BR><BR>Breakdown:<BR>Spel Semiconduct's net sales have experienced a downward trend from Mar'13, where they peaked at 80.53 Cr, to Mar'17, where they fell to 35.66 Cr. Other operating income has also decreased, with Mar'17 reporting only 0.01 Cr compared to 0.68 Cr in Mar'11. Total operating income followed a similar pattern, declining from 91.46 Cr in Mar'11 to 35.67 Cr in Mar'17. The company's total expenditure, excluding depreciation, peaked at 70.00 Cr in Mar'13 but has since stabilized around 36.96 Cr in Mar'17. Operating profit, which was positive in earlier years, turned negative in Mar'16 and Mar'17, with a loss of 1.29 Cr in Mar'17. Profit before tax has also been negative since Mar'15, reaching -8.44 Cr in Mar'17. Consequently, the profit after tax has shown a similar trend, with a loss of 8.82 Cr in Mar'17 compared to a loss of 19.80 Cr in Mar'16. The earnings per share reflect this downturn, with Mar'17 showing -1.91 compared to -4.29 in Mar'16. Overall, Spel Semiconduct has faced significant challenges in maintaining profitability and revenue growth over the years.

View full answer

Are Spel Semiconduct latest results good or bad?

25-Nov-2025

Spel Semiconductor's latest results are concerning, reporting a net loss of ₹1.12 crore in Q2 FY26, a significant decline from the previous quarter's profit. With a 33.65% drop in net sales quarter-on-quarter and a troubling return on equity of -70.20%, the company is facing critical financial distress.

Spel Semiconductor's latest results are quite concerning and can be classified as bad. In Q2 FY26, the company reported a net loss of ₹1.12 crore, which indicates that it is still struggling to achieve profitability. This loss is a significant decline from a small profit of ₹0.05 crore in the previous quarter. <BR><BR>Moreover, the company's net sales have also taken a severe hit, with a 33.65% decline quarter-on-quarter and a staggering 58.59% drop year-on-year, bringing net sales down to ₹8.32 crores. The persistent decline in sales reflects a troubling trend, as the company has experienced a 5-year sales growth rate of -24.88%, indicating a long-term structural decline.<BR><BR>Additionally, the return on equity (ROE) is alarming at -70.20%, which signifies that the company is destroying shareholder value. The high price-to-book value ratio of 56.24x further highlights the disconnect between the company's market valuation and its financial performance.<BR><BR>Overall, the combination of ongoing losses, declining revenues, and poor return metrics paints a bleak picture for Spel Semiconductor, suggesting that the company is in a critical operational and financial distress.

View full answer

Is Spel Semiconduct overvalued or undervalued?

09-Jun-2025

As of November 8, 2023, Spel Semiconduct is considered overvalued with a risky valuation grade, indicated by a negative PE ratio of -74.80, a high Price to Book Value of 19.18, and a year-to-date return of -22.15%, contrasting with the Sensex's positive return of 5.63%.

As of 8 November 2023, the valuation grade for Spel Semiconduct has moved from very expensive to risky, indicating a shift in perception regarding its valuation. The company appears to be overvalued given its significant negative PE ratio of -74.80 and a Price to Book Value of 19.18, which suggests that the market is pricing the stock at a premium relative to its book value. Additionally, the EV to EBIT ratio stands at -86.12, further highlighting the challenges in profitability.<BR><BR>In comparison to its peers, while specific peer valuation data is not available, the high EV to Sales ratio of 84.25 raises concerns about the sustainability of its current price level. The company's recent stock performance has been underwhelming, with a year-to-date return of -22.15%, contrasting sharply with the Sensex's positive return of 5.63% over the same period. Overall, these factors suggest that Spel Semiconduct is overvalued in the current market environment.

View full answer

Who are the top shareholders of the Spel Semiconduct?

06-Jun-2025

The top shareholders of Spel Semiconduct include Natronix Semiconductor Technology Private Limited with 55.97%, individual investors with 38.05%, and Hitesh Ramji Javeri as the highest public shareholder at 1.84%. There are also two mutual fund schemes and one foreign institutional investor, each holding 0.02%, with no pledged promoter holdings.

The top shareholders of Spel Semiconduct include Natronix Semiconductor Technology Private Limited, which holds the largest share at 55.97%. Individual investors collectively own 38.05% of the company. Additionally, Hitesh Ramji Javeri is the highest public shareholder with a stake of 1.84%. There are also two mutual fund schemes and one foreign institutional investor (FII), each holding 0.02%. Notably, there are no pledged promoter holdings.

View full answer

Has Spel Semiconduct declared dividend?

06-Jun-2025

No Dividend History Available

iScoreScore
Click here to find our call on this stock
Strong Sell
Sell
Hold
Buy
Strong Buy

Dashboard

1

With a Operating Losses, the company has a Weak Long Term Fundamental Strength

  • Low ability to service debt as the company has a high Debt to EBITDA ratio of -19.51 times
  • The company has been able to generate a Return on Equity (avg) of 3.38% signifying low profitability per unit of shareholders funds
2

Flat results in Jun 26

3

Risky - Negative EBITDA

stock-summaryMojo Parameters

Mojo Parameters

Loading Valuation Snapshot...

Stock DNA

stock-summary
Industry

Other Electrical Equipment

stock-summary
Market cap

INR Cr (Micro Cap)

stock-summary
P/E

NA (Loss Making)

stock-summary
Industry P/E

NA

stock-summary
Dividend Yield

0.00%

stock-summary
Debt Equity

0.00

stock-summary
Return on Equity

0.00%

stock-summary
Price to Book

0.00

Revenue and Profits:
Net Sales:
0 Cr
(Quarterly Results - Jun 2026)
Net Profit:
-1 Cr
stock-summaryTotal Returns
Total Returns (Price + Dividend) stock-summary
Icon
Company does not have enough history
Risk Adjusted Returns v/s stock-summary
Returns Beta
Icon
Beta has not been calculated since enough price history is not available
stock-summaryNews & Corporate Actions

News

Announcements stock-summary

Icon
No announcement available

Corporate Actions stock-summary

stock-summary
BOARD MEETING

No Upcoming Board Meetings

stock-summary
DIVIDEND

No Dividend history available

stock-summary
SPLITS

No Splits history available

stock-summary
BONUS

No Bonus history available

stock-summary
RIGHTS

No Rights history available

stock-summaryKey Factors

Quality key factors stock-summary

Factor
Value
Sales Growth (5y)
-19.17%
EBIT Growth (5y)
12.45%
EBIT to Interest (avg)
-3.38
Debt to EBITDA (avg)
Negative Net Debt
Net Debt to Equity (avg)
6.85
Sales to Capital Employed (avg)
0.23
Tax Ratio
1.83%
Dividend Payout Ratio
0
Pledged Shares
0
Institutional Holding
0.04%
ROCE (avg)
-12.67%
ROE (avg)
3.38%

Valuation key factors

Factor
Value
P/E Ratio
NA (Loss Making)
Industry P/E
38
Price to Book Value
225.07
EV to EBIT
-282.94
EV to EBITDA
-520.10
EV to Capital Employed
29.56
EV to Sales
160.03
PEG Ratio
NA
Dividend Yield
NA
ROCE (Latest)
-9.28%
ROE (Latest)
-129.18%

Technicals key factors

Indicator
Weekly
Monthly
MACD
Bearish
Mildly Bearish
RSI
No Signal
No Signal
Bollinger Bands
Sideways
Bullish
Moving Averages
Mildly Bullish (Daily)
KST
Mildly Bearish
Mildly Bearish
Dow Theory
No Trend
No Trend
OBV
No Trend
No Trend
stock-summary Technical Indicator Scale: Bearish, Mildly Bearish, Sideways, Mildly Bullish, Bullish  Turned 
stock-summaryShareholding
Shareholding Snapshot : Jun 2026stock-summary
Shareholding Compare (%holding) stock-summary
Majority shareholders

Promoters

Pledged Promoter Holdings

None

Mutual Funds

Held by 2 Schemes (0.02%)

FIIs

Held by 1 FIIs (0.02%)

Promoter with highest holding

Natronix Semiconductor Technology Private Limited (55.97%)

Highest Public shareholder

None

Individual Investors Holdings

38.22%

stock-summaryFinancial
[
  {
    "link": "quarterly",
    "btn_text": "All Quarterly Results",
    "header": "Quarterly Results Snapshot (Standalone) - Jun'26 - QoQ",
    "rhs": [
      {
        "prefix": "Net Sales ",
        "suffix": "QoQ Growth in quarter ended Jun 2026 is -96.33% vs 246.03% in Mar 2026",
        "dir": -1
      },
      {
        "prefix": "Standalone Net Profit ",
        "suffix": "QoQ Growth in quarter ended Jun 2026 is -274.03% vs 111.74% in Mar 2026",
        "dir": -1
      }
    ],
    "table": {
      "header": [
        "Jun'26",
        "Mar'26",
        "Change(%)"
      ],
      "body": [
        {
          "field": "Net Sales",
          "val1": "0.08",
          "val2": "2.18",
          "chgp": "-96.33%",
          "chgp_class": "negative"
        },
        {
          "field": "Operating Profit (PBDIT) excl Other Income",
          "val1": "-0.85",
          "val2": "1.75",
          "chgp": "-148.57%",
          "chgp_class": "negative"
        },
        {
          "field": "Interest",
          "val1": "0.62",
          "val2": "1.78",
          "chgp": "-65.17%",
          "chgp_class": "positive"
        },
        {
          "field": "Exceptional Items",
          "val1": "0.00",
          "val2": "0.27",
          "chgp": "-100.00%",
          "chgp_class": "negative"
        },
        {
          "field": "Standalone Net Profit",
          "val1": "-1.34",
          "val2": "0.77",
          "chgp": "-274.03%",
          "chgp_class": "negative"
        },
        {
          "field": "Operating Profit Margin (Excl OI)",
          "val1": "-1,062.50%",
          "val2": "80.28%",
          "chgp": "-1,142.78%",
          "chgp_class": "negative"
        }
      ]
    }
  },
  {
    "link": "half-yearly",
    "btn_text": "All Half Yearly Results",
    "header": "Half Yearly Results Snapshot (Standalone) - Sep'25",
    "rhs": [
      {
        "prefix": "Net Sales ",
        "suffix": " Growth in half year ended Sep 2025 is -1.98% vs -51.91% in Sep 2024",
        "dir": 1
      },
      {
        "prefix": "Standalone Net Profit ",
        "suffix": " Growth in half year ended Sep 2025 is -119.32% vs -5.92% in Sep 2024",
        "dir": -1
      }
    ],
    "table": {
      "header": [
        "Sep'25",
        "Sep'24",
        "Change(%)"
      ],
      "body": [
        {
          "field": "Net Sales",
          "val1": "3.46",
          "val2": "3.53",
          "chgp": "-1.98%",
          "chgp_class": "negative"
        },
        {
          "field": "Operating Profit (PBDIT) excl Other Income",
          "val1": "-1.19",
          "val2": "-2.23",
          "chgp": "46.64%",
          "chgp_class": "positive"
        },
        {
          "field": "Interest",
          "val1": "2.67",
          "val2": "1.47",
          "chgp": "81.63%",
          "chgp_class": "negative"
        },
        {
          "field": "Exceptional Items",
          "val1": "-14.51",
          "val2": "-3.96",
          "chgp": "-266.41%",
          "chgp_class": "negative"
        },
        {
          "field": "Standalone Net Profit",
          "val1": "-18.05",
          "val2": "-8.23",
          "chgp": "-119.32%",
          "chgp_class": "negative"
        },
        {
          "field": "Operating Profit Margin (Excl OI)",
          "val1": "-34.39%",
          "val2": "-63.17%",
          "chgp": "28.78%",
          "chgp_class": "positive"
        }
      ]
    }
  },
  {
    "link": "nine-monthly",
    "btn_text": "All Nine Monthly Results",
    "header": "Nine Monthly Results Snapshot (Standalone) - Dec'25",
    "rhs": [
      {
        "prefix": "Net Sales ",
        "suffix": "YoY Growth in nine months ended Dec 2025 is -24.54% vs -43.66% in Dec 2024",
        "dir": 1
      },
      {
        "prefix": "Standalone Net Profit ",
        "suffix": "YoY Growth in nine months ended Dec 2025 is -88.58% vs -8.48% in Dec 2024",
        "dir": -1
      }
    ],
    "table": {
      "header": [
        "Dec'25",
        "Dec'24",
        "Change(%)"
      ],
      "body": [
        {
          "field": "Net Sales",
          "val1": "4.09",
          "val2": "5.42",
          "chgp": "-24.54%",
          "chgp_class": "negative"
        },
        {
          "field": "Operating Profit (PBDIT) excl Other Income",
          "val1": "-2.82",
          "val2": "-2.92",
          "chgp": "3.42%",
          "chgp_class": "positive"
        },
        {
          "field": "Interest",
          "val1": "3.27",
          "val2": "2.10",
          "chgp": "55.71%",
          "chgp_class": "negative"
        },
        {
          "field": "Exceptional Items",
          "val1": "-19.09",
          "val2": "-7.25",
          "chgp": "-163.31%",
          "chgp_class": "negative"
        },
        {
          "field": "Standalone Net Profit",
          "val1": "-24.61",
          "val2": "-13.05",
          "chgp": "-88.58%",
          "chgp_class": "negative"
        },
        {
          "field": "Operating Profit Margin (Excl OI)",
          "val1": "-68.95%",
          "val2": "-53.87%",
          "chgp": "-15.08%",
          "chgp_class": "negative"
        }
      ]
    }
  },
  {
    "link": "annual",
    "btn_text": "All Annual Results",
    "header": "Annual Results Snapshot (Standalone) - Mar'26",
    "rhs": [
      {
        "prefix": "Net Sales ",
        "suffix": "YoY Growth in year ended Mar 2026 is -20.10% vs -34.50% in Mar 2025",
        "dir": 1
      },
      {
        "prefix": "Standalone Net Profit ",
        "suffix": "YoY Growth in year ended Mar 2026 is -13.25% vs -25.37% in Mar 2025",
        "dir": 1
      }
    ],
    "table": {
      "header": [
        "Mar'26",
        "Mar'25",
        "Change(%)"
      ],
      "body": [
        {
          "field": "Net Sales",
          "val1": "6.28",
          "val2": "7.86",
          "chgp": "-20.10%",
          "chgp_class": "negative"
        },
        {
          "field": "Operating Profit (PBDIT) excl Other Income",
          "val1": "-1.07",
          "val2": "-5.68",
          "chgp": "81.16%",
          "chgp_class": "positive"
        },
        {
          "field": "Interest",
          "val1": "5.06",
          "val2": "2.88",
          "chgp": "75.69%",
          "chgp_class": "negative"
        },
        {
          "field": "Exceptional Items",
          "val1": "-18.82",
          "val2": "-12.57",
          "chgp": "-49.72%",
          "chgp_class": "negative"
        },
        {
          "field": "Standalone Net Profit",
          "val1": "-23.84",
          "val2": "-21.05",
          "chgp": "-13.25%",
          "chgp_class": "negative"
        },
        {
          "field": "Operating Profit Margin (Excl OI)",
          "val1": "-17.04%",
          "val2": "-72.26%",
          "chgp": "55.22%",
          "chgp_class": "positive"
        }
      ]
    }
  }
]

Quarterly Results Snapshot (Standalone) - Jun'26 - QoQstock-summary

Jun'26
Mar'26
Change(%)
Net Sales
0.08
2.18
-96.33%
Operating Profit (PBDIT) excl Other Income
-0.85
1.75
-148.57%
Interest
0.62
1.78
-65.17%
Exceptional Items
0.00
0.27
-100.00%
Standalone Net Profit
-1.34
0.77
-274.03%
Operating Profit Margin (Excl OI)
-1,062.50%
80.28%
-1,142.78%
Values in Rs Cr.
Direction Arrows
Net Sales

QoQ Growth in quarter ended Jun 2026 is -96.33% vs 246.03% in Mar 2026

Direction Arrows
Standalone Net Profit

QoQ Growth in quarter ended Jun 2026 is -274.03% vs 111.74% in Mar 2026

Half Yearly Results Snapshot (Standalone) - Sep'25stock-summary

Sep'25
Sep'24
Change(%)
Net Sales
3.46
3.53
-1.98%
Operating Profit (PBDIT) excl Other Income
-1.19
-2.23
46.64%
Interest
2.67
1.47
81.63%
Exceptional Items
-14.51
-3.96
-266.41%
Standalone Net Profit
-18.05
-8.23
-119.32%
Operating Profit Margin (Excl OI)
-34.39%
-63.17%
28.78%
Values in Rs Cr.
Direction Arrows
Net Sales

Growth in half year ended Sep 2025 is -1.98% vs -51.91% in Sep 2024

Direction Arrows
Standalone Net Profit

Growth in half year ended Sep 2025 is -119.32% vs -5.92% in Sep 2024

Nine Monthly Results Snapshot (Standalone) - Dec'25stock-summary

Dec'25
Dec'24
Change(%)
Net Sales
4.09
5.42
-24.54%
Operating Profit (PBDIT) excl Other Income
-2.82
-2.92
3.42%
Interest
3.27
2.10
55.71%
Exceptional Items
-19.09
-7.25
-163.31%
Standalone Net Profit
-24.61
-13.05
-88.58%
Operating Profit Margin (Excl OI)
-68.95%
-53.87%
-15.08%
Values in Rs Cr.
Direction Arrows
Net Sales

YoY Growth in nine months ended Dec 2025 is -24.54% vs -43.66% in Dec 2024

Direction Arrows
Standalone Net Profit

YoY Growth in nine months ended Dec 2025 is -88.58% vs -8.48% in Dec 2024

Annual Results Snapshot (Standalone) - Mar'26stock-summary

Mar'26
Mar'25
Change(%)
Net Sales
6.28
7.86
-20.10%
Operating Profit (PBDIT) excl Other Income
-1.07
-5.68
81.16%
Interest
5.06
2.88
75.69%
Exceptional Items
-18.82
-12.57
-49.72%
Standalone Net Profit
-23.84
-21.05
-13.25%
Operating Profit Margin (Excl OI)
-17.04%
-72.26%
55.22%
Values in Rs Cr.
Direction Arrows
Net Sales

YoY Growth in year ended Mar 2026 is -20.10% vs -34.50% in Mar 2025

Direction Arrows
Standalone Net Profit

YoY Growth in year ended Mar 2026 is -13.25% vs -25.37% in Mar 2025

stock-summaryCompany CV
About Spel Semiconductor Ltd stock-summary
stock-summary
Spel Semiconductor Ltd
Micro Cap
Other Electrical Equipment
Spel Semiconductor Limited (SSL) (earlier known as Spic Electronics and Systems Ltd) was incorporated as a Private Company in Dec.'84 and thereafter converted into a Public Company in Mar.'86. It was promoted by Southern Petrochemical Industries (SPIC). SSL went public in Aug.'88 to part-finance the cost of setting up a sophisticated electronic project for manufacture of computer tapes, diskettes, jumbo rolls and integrated circuits.
Company Coordinates stock-summary
Company Details
5 CMDA Industrial Estate, Maraimalai Nagar Chennai Tamil Nadu : 603209
stock-summary
Tel: 91-044-47405300
stock-summary
info@spel.com
Registrar Details
Cameo Corporate Services Ltd , Subramanian Buildings No 1 , Club House Road, Chennai