
Compare Spice IslandsInd with Similar Stocks
Dashboard
The company has declared Positive results for the last 5 consecutive quarters
- PAT(9M) At Rs 5.33 cr has Grown at 1,169.05%
- PBDIT(Q) Highest at Rs 1.12 cr.
- PBT LESS OI(Q) Highest at Rs 1.08 cr.
With ROE of 40.4, it has a Very Expensive valuation with a 13.3 Price to Book Value
Majority shareholders : Promoters
Consistent Returns over the last 3 years
Stock DNA
Gems, Jewellery And Watches
INR 177 Cr (Micro Cap)
33.00
23
0.23%
-0.27
40.37%
13.17
Total Returns (Price + Dividend) 
Latest dividend: 0.5 per share ex-dividend date: Feb-27-2026
Risk Adjusted Returns v/s
Returns Beta

News
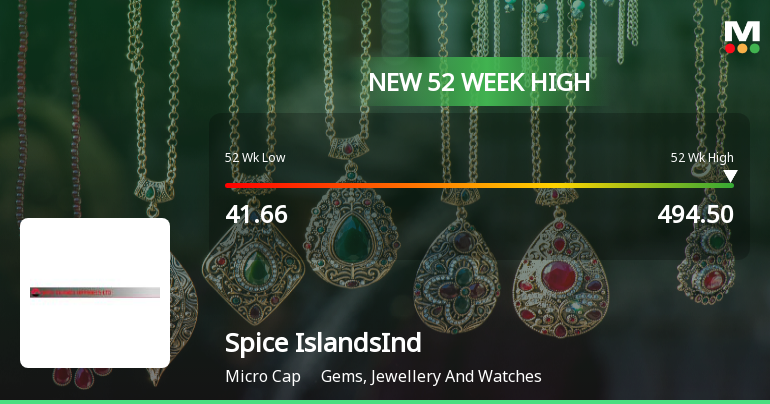
Broad-Based Technical Strength Lifts Spice Islands Industries Ltd to 52-Week High of Rs 494.5
Surging past its previous peaks, Spice Islands Industries Ltd reached a new 52-week high of Rs 494.5 on 09 Jun 2026, marking a remarkable ascent from its 52-week low of Rs 41.66. This rally, driven by a confluence of strong technical indicators and sustained price momentum, underscores the stock’s exceptional performance in a market environment where the broader Sensex remains subdued.
Read full news article
Spice Islands Industries Ltd Hits All-Time High of Rs 494.5 as Momentum Builds Across Timeframes
Extending its winning streak to seven consecutive sessions, Spice Islands Industries Ltd surged to a fresh all-time high of Rs 494.5 on 09 Jun 2026, outperforming its sector and the broader market by a wide margin.
Read full news article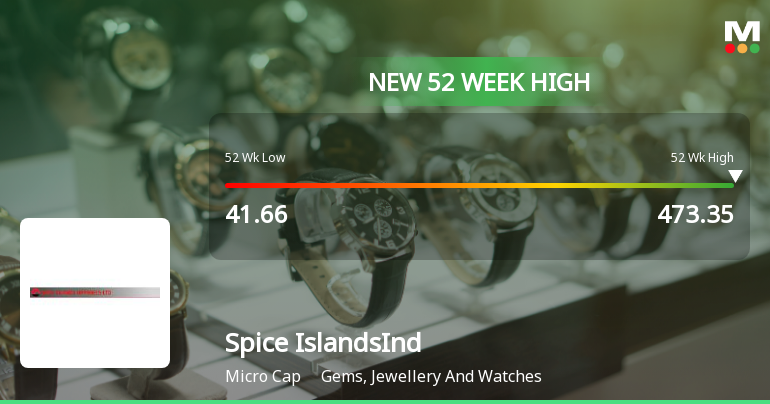
Broad-Based Technical Strength Lifts Spice Islands Industries Ltd to 52-Week High of Rs 473.35
Surging to an all-time high of Rs 473.35 on 8 Jun 2026, Spice Islands Industries Ltd has demonstrated remarkable price momentum, rallying over 910% in the past year. This milestone comes amid a backdrop of broad technical alignment and sustained buying interest, setting the stock apart in a market where the Sensex remains under pressure.
Read full news article Announcements
Announcement under Regulation 30 (LODR)-Memorandum of Understanding /Agreements
05-Jun-2026 | Source : BSEIntimation under Regulation 30 of the SEBI (LODR) 2015 - Execution of the Joint Venture Agreement with the Peace Mission Private Limited
Board Meeting Outcome for Outcome Of The Board Meeting Under Regulation 30 Of The SEBI (LODR) Regulations 2015 - Execution Of Joint Venture Agreement With The Peace Mission Private Limited
05-Jun-2026 | Source : BSEOutcome of the Board Meeting under Regulation 30 of the SEBI (LODR) 2015 - Execution of Joint Venture Agreement with the Peace Mission Private Limited
Announcement under Regulation 30 (LODR)-Newspaper Publication
01-Jun-2026 | Source : BSEDisclosure under Regulation 47 of SEBI (Listing Obligation and Disclosure Requirements) Regulations 2015 - Financial Results published in Newspaper
Corporate Actions

No Upcoming Board Meetings

Spice Islands Industries Ltd has declared 6% dividend, ex-date: 31 Jul 26

No Splits history available

No Bonus history available

No Rights history available
Quality key factors
Valuation key factors
Technicals key factors
 Technical Indicator Scale: Bearish, Mildly Bearish, Sideways, Mildly Bullish, Bullish Turned
 Shareholding Snapshot : Dec 2025
Shareholding Compare (%holding)
Promoters
None
Held by 0 Schemes
Held by 0 FIIs
Fotoset Trading Private Limited (62.5%)
Mahendra Girdharilal Wadhwani (2.69%)
30.52%
Quarterly Results Snapshot (Standalone) - Mar'26 - QoQ

QoQ Growth in quarter ended Mar 2026 is 228.61% vs 90.80% in Dec 2025
QoQ Growth in quarter ended Mar 2026 is 111.64% vs 87.18% in Dec 2025
Half Yearly Results Snapshot (Standalone) - Sep'25
Growth in half year ended Sep 2025 is 976.47% vs 6.25% in Sep 2024
Growth in half year ended Sep 2025 is 227.59% vs -769.23% in Sep 2024
Nine Monthly Results Snapshot (Standalone) - Dec'25
YoY Growth in nine months ended Dec 2025 is 941.79% vs 59.52% in Dec 2024
YoY Growth in nine months ended Dec 2025 is 337.96% vs -640.00% in Dec 2024
Annual Results Snapshot (Standalone) - Mar'26
YoY Growth in year ended Mar 2026 is 2,193.59% vs -13.33% in Mar 2025
YoY Growth in year ended Mar 2026 is 1,079.17% vs 50.00% in Mar 2025
About Spice Islands Industries Ltd

Company Coordinates


