
Compare Spice LoungeFood with Similar Stocks
Stock DNA
Non Banking Financial Company (NBFC)
INR 1,721 Cr (Small Cap)
177.00
20
0.00%
0.96
7.88%
13.90
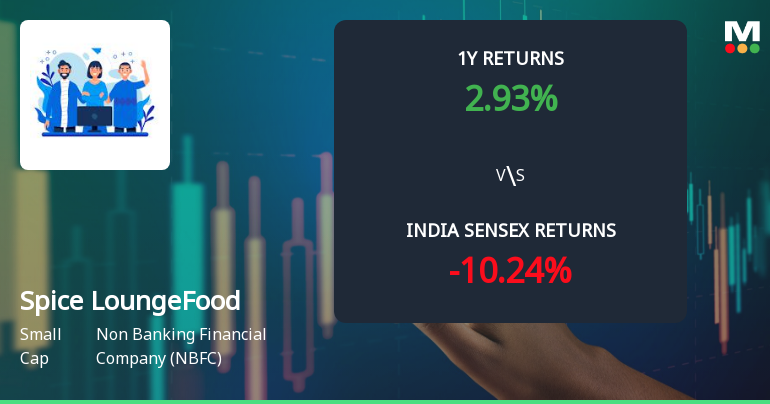
Total Returns (Price + Dividend) 
Spice LoungeFood for the last several years.
Risk Adjusted Returns v/s
Returns Beta

News
Spice Lounge Food Works Ltd Technical Momentum Shifts Amid Mixed Market Signals
Spice Lounge Food Works Ltd, a small-cap player in the Non Banking Financial Company (NBFC) sector, has exhibited a modest price momentum shift, moving from a strongly bearish technical stance to a mildly bearish outlook. Despite a 2.66% gain on 8 June 2026, the stock’s technical indicators present a complex picture, reflecting cautious optimism amid lingering bearish pressures.
Read full news article
Spice Lounge Food Works Ltd Upgraded to Sell on Improved Financial and Technical Metrics
Spice Lounge Food Works Ltd has seen its investment rating upgraded from Strong Sell to Sell, reflecting significant improvements in its financial performance and technical indicators. Despite lingering concerns over valuation and long-term fundamentals, the company’s recent quarterly results and market behaviour have prompted a reassessment of its outlook within the Non Banking Financial Company (NBFC) sector.
Read full news article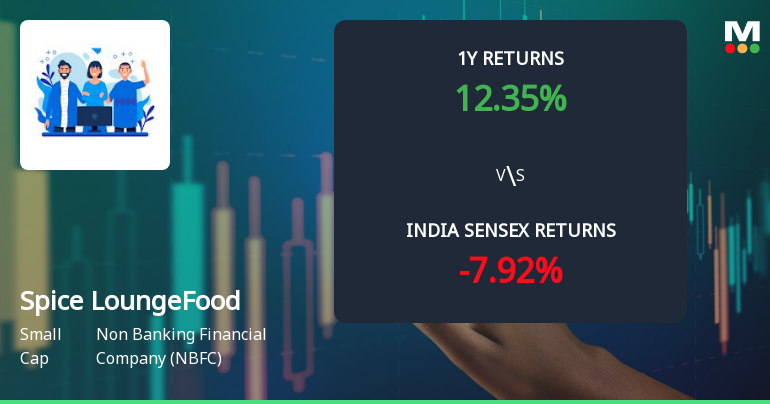
Spice Lounge Food Works Ltd Technical Momentum Shifts Amid Mixed Market Signals
Spice Lounge Food Works Ltd, a small-cap player in the Non Banking Financial Company (NBFC) sector, has experienced a notable shift in its technical momentum, moving from a bearish to a mildly bearish trend. Despite a modest day gain of 1.15%, the stock’s technical indicators present a complex picture, reflecting mixed signals that investors should carefully analyse amid broader market conditions.
Read full news article Announcements
Clarification On Price Movement
02-Jun-2026 | Source : BSEClarification on Price Movement
Board Meeting Outcome for AUDITED FINANCIAL RESULTS (STANDALONE AND CONSOLIDATED) AS ON 31.03.2026
29-May-2026 | Source : BSEAUDITED FINANCIAL RESULTS (STANDALONE AND CONSOLIDATED) AS ON 31.03.2026
AUDITED RESULTS FOR THE 4TH QUARTER AND YEAR ENDED 31.03.2026
29-May-2026 | Source : BSEAUDITED RESULTS FOR THE 4TH QUARTER AND YEAR ENDED 31.03.2026
Corporate Actions

No Upcoming Board Meetings

No Dividend history available

Spice Lounge Food Works Ltd has announced 1:10 stock split, ex-date: 13 Mar 25

No Bonus history available

No Rights history available
Quality key factors
Valuation key factors
Technicals key factors
 Technical Indicator Scale: Bearish, Mildly Bearish, Sideways, Mildly Bullish, Bullish Turned
 Shareholding Snapshot : Mar 2026
Shareholding Compare (%holding)
Non Institution
None
Held by 0 Schemes
Held by 0 FIIs
None
Mohana Babu Karjela (40.36%)
50.06%
Quarterly Results Snapshot (Standalone) - Mar'26 - YoY

YoY Growth in quarter ended Mar 2026 is 212.50% vs 0.00% in Mar 2025

YoY Growth in quarter ended Mar 2026 is -86.67% vs 400.00% in Mar 2025
Half Yearly Results Snapshot (Standalone) - Sep'25
Growth in half year ended Sep 2025 is 681.82% vs 0.00% in Sep 2024
Growth in half year ended Sep 2025 is 666.67% vs 0.00% in Sep 2024
Nine Monthly Results Snapshot (Standalone) - Dec'25
YoY Growth in nine months ended Dec 2025 is 258.82% vs 0.00% in Dec 2024
YoY Growth in nine months ended Dec 2025 is 525.00% vs 0.00% in Dec 2024
Annual Results Snapshot (Standalone) - Mar'26
YoY Growth in year ended Mar 2026 is 236.36% vs 0.00% in Mar 2025
YoY Growth in year ended Mar 2026 is 36.84% vs 480.00% in Mar 2025
About Spice Lounge Food Works Ltd

Company Coordinates


