
Compare SPML Infra with Similar Stocks
Dashboard
High Debt company with Weak Long Term Fundamental Strength
- Poor long term growth as Net Sales has grown by an annual rate of 4.87% over the last 5 years
- High Debt Company with a Debt to Equity ratio (avg) of 2.34 times
- The company has been able to generate a Return on Equity (avg) of 2.86% signifying low profitability per unit of shareholders funds
With a growth in Net Profit of 143.12%, the company declared Very Positive results in Mar 26
With ROCE of 5.4, it has a Attractive valuation with a 1.6 Enterprise value to Capital Employed
Despite the size of the company, domestic mutual funds hold only 0% of the company
Total Returns (Price + Dividend) 
Latest dividend: 0.5 per share ex-dividend date: Sep-26-2011
Risk Adjusted Returns v/s
Returns Beta

News

SPML Infra Ltd Technical Momentum Shifts Signal Bullish Outlook Amid Market Volatility
SPML Infra Ltd has demonstrated a notable shift in technical momentum, upgrading from a mildly bullish to a bullish trend as of late June 2026. This change is underpinned by a confluence of positive signals from key technical indicators including MACD, Bollinger Bands, and moving averages, suggesting renewed investor confidence despite the company’s mixed longer-term returns relative to the Sensex.
Read full news article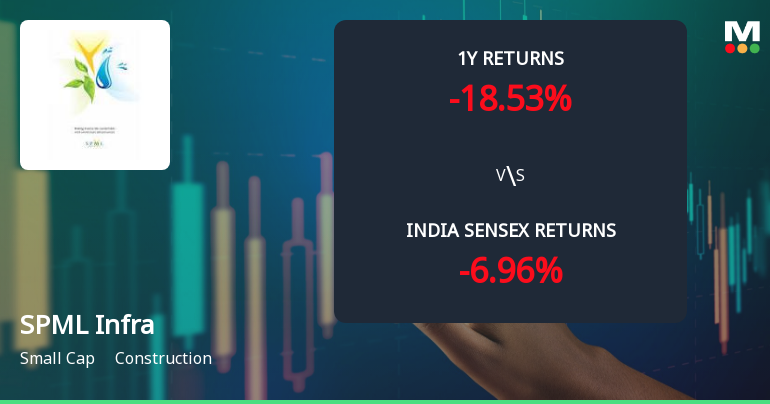
SPML Infra Ltd Technical Momentum Shifts Amid Mixed Indicator Signals
SPML Infra Ltd has experienced a nuanced shift in its technical momentum, reflecting a transition from a bullish to a mildly bullish trend. Despite a recent day decline of 2.67%, the stock’s technical indicators present a complex picture, with weekly signals largely positive but monthly metrics showing caution. This article analyses the latest technical parameters, price momentum, and comparative returns to provide a comprehensive view for investors.
Read full news article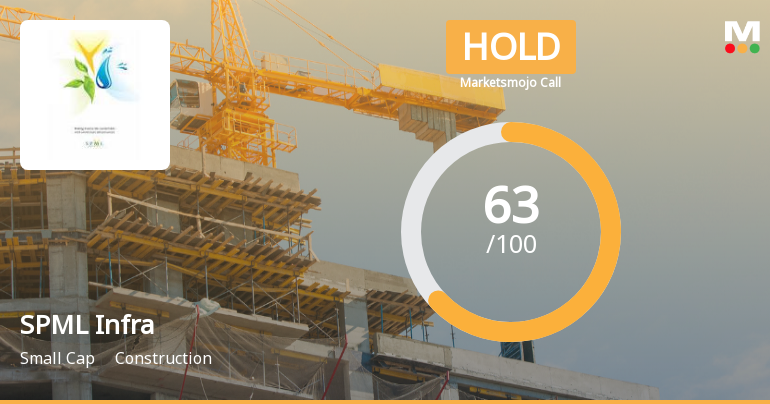
SPML Infra Ltd Upgraded to Hold as Technicals and Financials Show Improvement
SPML Infra Ltd has seen its investment rating upgraded from Sell to Hold, driven primarily by a marked improvement in technical indicators and robust quarterly financial results. The construction sector company’s Mojo Score has risen to 63.0, reflecting a more balanced outlook amid mixed fundamental signals and a positive shift in market sentiment.
Read full news article Announcements
SPML Infra Limited - Press Release
09-Dec-2019 | Source : NSESPML Infra Limited has informed the Exchange regarding a press release dated December 09, 2019, titled "SPML Infra Ltd. received New Project Orders worth Rs. 218 Crore".
SPML Infra Limited - Updates
15-Nov-2019 | Source : NSESPML Infra Limited has informed the Exchange regarding 'Submission of Newspaper Advertisement under Reg. 47 of SEBI (Listing Obligations & Disclosure Requirements) Regulations, 2015'. With reference to the captioned subject and in terms of Regulation 47(3) of the SEBI [Listing Obligations and Disclosure Requirements] Regulations, 2015, we are submitting herewith the extract of the Newspaper Advertisement with respect to "Extracts of the Standalone & Consolidated Un-audited Financial Results for the Second quarter and half year ended 30th September, 2019 as Published in the Business Standard Hindi as well as English edition on 14th November, 2019. An extract of the aforesaid advertisement is enclosed for your reference.
SPML Infra Limited - Outcome of Board Meeting
13-Nov-2019 | Source : NSESPML Infra Limited has informed the Exchange regarding Board meeting held on November 12, 2019. With reference to the captioned subject and in terms In terms of the Regulation 30 of the SEBI (Listing Obligations & Disclosure Requirements) Regulations, 2015, we would like to inform you that Board of Directors in the Meeting held on 12th November, 2019, interalia, has considered and approved the following:
Corporate Actions

No Upcoming Board Meetings

SPML Infra Ltd has declared 25% dividend, ex-date: 26 Sep 11

No Splits history available

No Bonus history available

No Rights history available
Quality key factors
Valuation key factors
Technicals key factors
 Technical Indicator Scale: Bearish, Mildly Bearish, Sideways, Mildly Bullish, Bullish Turned
 Shareholding Snapshot : Apr 2026
Shareholding Compare (%holding)
Non Institution
24.534
Held by 0 Schemes
Held by 12 FIIs (0.36%)
Zoom Industrial Services Ltd (18.32%)
National Asset Reconstruction Company Limited (13.22%)
25.57%
Quarterly Results Snapshot (Consolidated) - Mar'26 - YoY

YoY Growth in quarter ended Mar 2026 is 53.68% vs -59.01% in Mar 2025

YoY Growth in quarter ended Mar 2026 is 126.31% vs 235.40% in Mar 2025
Half Yearly Results Snapshot (Consolidated) - Sep'25
Growth in half year ended Sep 2025 is -13.07% vs -34.71% in Sep 2024
Growth in half year ended Sep 2025 is 4.50% vs 3,189.87% in Sep 2024
Nine Monthly Results Snapshot (Consolidated) - Dec'25
YoY Growth in nine months ended Dec 2025 is -1.68% vs -32.01% in Dec 2024
YoY Growth in nine months ended Dec 2025 is 32.20% vs 1,791.05% in Dec 2024
Annual Results Snapshot (Consolidated) - Mar'26
YoY Growth in year ended Mar 2026 is 11.76% vs -41.09% in Mar 2025
YoY Growth in year ended Mar 2026 is 55.78% vs 787.80% in Mar 2025
About SPML Infra Ltd

Company Coordinates


