
Compare Sr.Rayala.Hypo with Similar Stocks
Stock DNA
Commodity Chemicals
INR 842 Cr (Micro Cap)
9.00
47
0.59%
-0.44
10.06%
0.86
Total Returns (Price + Dividend) 
Latest dividend: 3.0134551495016613 per share ex-dividend date: Sep-19-2025
Risk Adjusted Returns v/s
Returns Beta

News
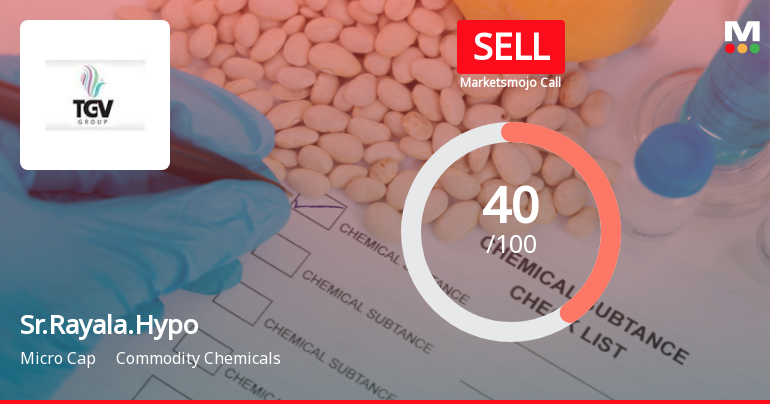
Sree Rayalaseema Hi-Strength Hypo Ltd Downgraded to Sell Amid Technical and Financial Weakness
Sree Rayalaseema Hi-Strength Hypo Ltd, a micro-cap player in the commodity chemicals sector, has seen its investment rating downgraded from Hold to Sell as of 17 July 2026. The revision reflects deteriorating technical indicators, subdued financial performance, and valuation concerns, signalling caution for investors amid a challenging market environment.
Read full news article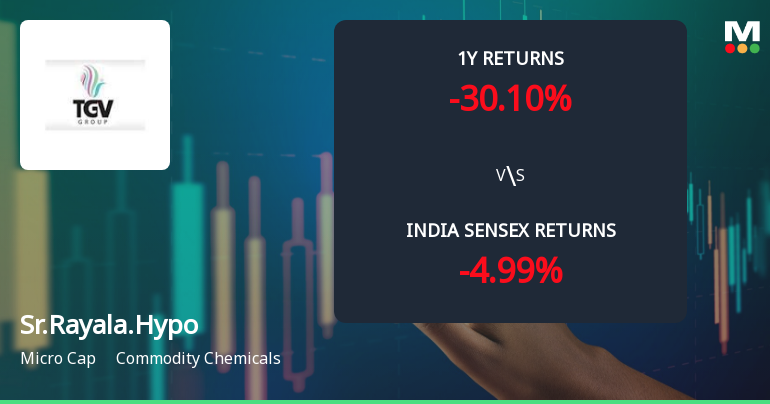
Sree Rayalaseema Hi-Strength Hypo Ltd Faces Technical Momentum Shift Amid Bearish Indicators
Sree Rayalaseema Hi-Strength Hypo Ltd (Stock ID: 457610), a micro-cap player in the Commodity Chemicals sector, has experienced a notable shift in its technical momentum, prompting a downgrade in its Mojo Grade from Hold to Sell as of 17 July 2026. Despite a modest daily price decline of 0.92%, the stock’s broader technical indicators reveal a complex picture of weakening bullish trends and emerging bearish pressures.
Read full news article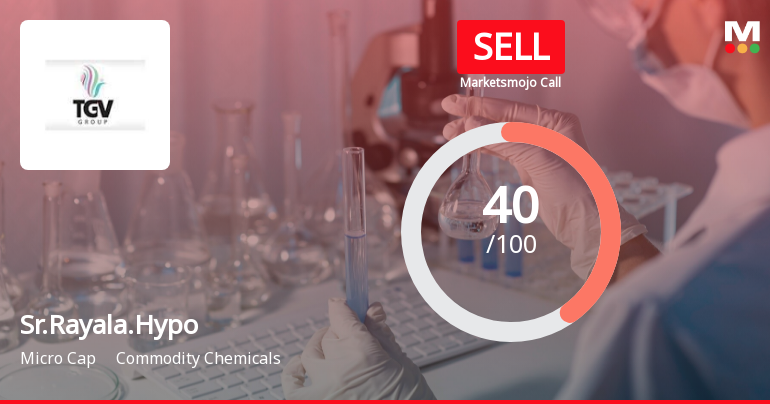
Sree Rayalaseema Hi-Strength Hypo Ltd is Rated Sell
Sree Rayalaseema Hi-Strength Hypo Ltd is rated Sell by MarketsMOJO. This rating was last updated on 17 July 2026. However, all fundamentals, returns, and financial metrics discussed here reflect the stock’s current position as of 18 July 2026, providing investors with the latest insights into the company’s performance and outlook.
Read full news article Announcements
Sree Rayalaseema Hi-Strength Hypo Limited - Press Release
15-Nov-2019 | Source : NSESree Rayalaseema Hi-Strength Hypo Limited has informed the Exchange regarding a press release dated November 14, 2019, titled "press release of Q2FY2020 and H1FY2020 ".
Sree Rayalaseema Hi-Strength Hypo Limited - Updates
17-Oct-2019 | Source : NSESree Rayalaseema Hi-Strength Hypo Limited has informed the Exchange regarding 'Submission of certificate under 74(5) of SEBI( Depositories and Participants ) Regulations, 2018'.
Updates
09-Sep-2019 | Source : NSE
| Sree Rayalaseema Hi-Strength Hypo Limited has informed the Exchange regarding ':Submission of newspaper cuttings with regard to date of 14th Annual General Meeting date of Book closures paper ads.'. |
Corporate Actions

No Upcoming Board Meetings

Sree Rayalaseema Hi-Strength Hypo Ltd has declared 30% dividend, ex-date: 19 Sep 25

No Splits history available

No Bonus history available

No Rights history available
Quality key factors
Valuation key factors
Technicals key factors
 Technical Indicator Scale: Bearish, Mildly Bearish, Sideways, Mildly Bullish, Bullish Turned
 Shareholding Snapshot : Jun 2026
Shareholding Compare (%holding)
Promoters
None
Held by 3 Schemes (0.01%)
Held by 5 FIIs (0.06%)
Gowri Gopal Hospitals Private Limited (21.8%)
None
26.08%
Quarterly Results Snapshot (Consolidated) - Mar'26 - QoQ

QoQ Growth in quarter ended Mar 2026 is 15.56% vs -22.60% in Dec 2025

QoQ Growth in quarter ended Mar 2026 is -15.54% vs 1.98% in Dec 2025
Half Yearly Results Snapshot (Consolidated) - Sep'25
Growth in half year ended Sep 2025 is 7.02% vs -30.32% in Sep 2024
Growth in half year ended Sep 2025 is 5.51% vs 2.64% in Sep 2024
Nine Monthly Results Snapshot (Consolidated) - Dec'25
YoY Growth in nine months ended Dec 2025 is 5.55% vs -31.89% in Dec 2024
YoY Growth in nine months ended Dec 2025 is 7.04% vs 10.20% in Dec 2024
Annual Results Snapshot (Consolidated) - Mar'26
YoY Growth in year ended Mar 2026 is 4.57% vs -26.35% in Mar 2025
YoY Growth in year ended Mar 2026 is 3.06% vs 10.76% in Mar 2025
About Sree Rayalaseema Hi-Strength Hypo Ltd

Company Coordinates


