
Compare Sr.Rayala.Hypo with Similar Stocks
Stock DNA
Commodity Chemicals
INR 860 Cr (Micro Cap)
9.00
41
0.59%
-0.44
10.06%
0.85
Total Returns (Price + Dividend) 
Latest dividend: 3 per share ex-dividend date: Sep-19-2025
Risk Adjusted Returns v/s
Returns Beta

News

Sree Rayalaseema Hi-Strength Hypo Ltd is Rated Sell
Sree Rayalaseema Hi-Strength Hypo Ltd is rated 'Sell' by MarketsMOJO. This rating was last updated on 10 February 2026, reflecting a shift from a previous 'Strong Sell' stance. However, all fundamentals, returns, and financial metrics discussed here are current as of 04 June 2026, providing investors with an up-to-date view of the stock's position.
Read full news article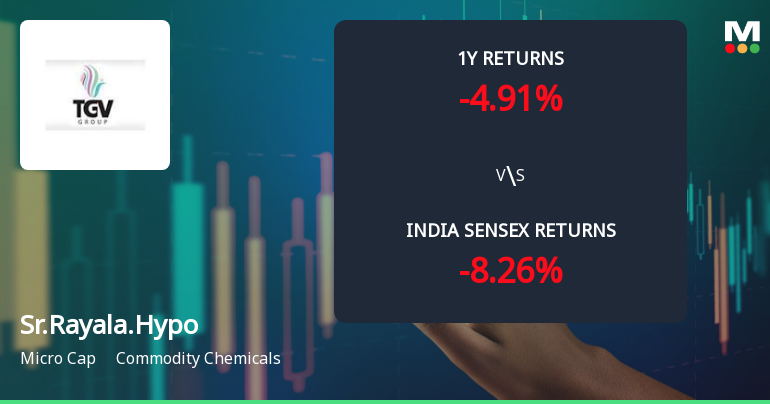
Sree Rayalaseema Hi-Strength Hypo Ltd: Technical Momentum Shifts Amid Mixed Signals
Sree Rayalaseema Hi-Strength Hypo Ltd, a micro-cap player in the Commodity Chemicals sector, has experienced a nuanced shift in its technical momentum, transitioning from a sideways trend to a mildly bearish stance. Despite a modest day gain of 0.41%, the stock’s technical indicators present a complex picture, with weekly signals showing bullish tendencies while monthly metrics suggest caution. This article analyses the recent technical developments, price momentum, and comparative returns to provide a comprehensive view for investors.
Read full news article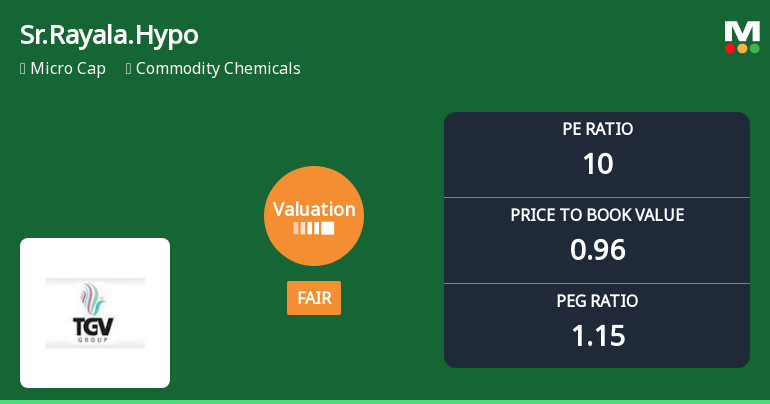
Sree Rayalaseema Hi-Strength Hypo Ltd Valuation Shifts Signal Changing Market Sentiment
Sree Rayalaseema Hi-Strength Hypo Ltd, a micro-cap player in the commodity chemicals sector, has seen a notable shift in its valuation parameters, moving from an attractive to a fair rating. This change reflects evolving market perceptions amid mixed financial metrics and relative peer comparisons, prompting a reassessment of its price attractiveness for investors.
Read full news article Announcements
Announcement under Regulation 30 (LODR)-Newspaper Publication
09-Jun-2026 | Source : BSESubmission of newspaper publications with regard to special window for lodgement/ relodgement of transfer requests and Saksham Niveshak- 100 days second campaign published in Business Standard on 08-06-2026 and Andhra Prabha on 09-06-2026.
Submission Of Report- Special Window
06-Jun-2026 | Source : BSESubmission of report issued by RTA as of May2026 with regard to special window for lodgement/ re-lodgement of transfer requests of physical shares
Announcement under Regulation 30 (LODR)-Newspaper Publication
01-Jun-2026 | Source : BSESubmission of newspaper publications of extract of audited standalone and consolidated financial results for quarter/ year ending 31-03-2026 published in Business standard and Andhra Prabha on 01-06-2026.
Corporate Actions

No Upcoming Board Meetings

Sree Rayalaseema Hi-Strength Hypo Ltd has declared 30% dividend, ex-date: 19 Sep 25

No Splits history available

No Bonus history available

No Rights history available
Quality key factors
Valuation key factors
Technicals key factors
 Technical Indicator Scale: Bearish, Mildly Bearish, Sideways, Mildly Bullish, Bullish Turned
 Shareholding Snapshot : Mar 2026
Shareholding Compare (%holding)
Promoters
None
Held by 3 Schemes (0.01%)
Held by 5 FIIs (0.06%)
Gowri Gopal Hospitals Private Limited (21.8%)
None
26.37%
Quarterly Results Snapshot (Consolidated) - Mar'26 - QoQ

QoQ Growth in quarter ended Mar 2026 is 15.56% vs -22.60% in Dec 2025

QoQ Growth in quarter ended Mar 2026 is -15.54% vs 1.98% in Dec 2025
Half Yearly Results Snapshot (Consolidated) - Sep'25
Growth in half year ended Sep 2025 is 7.02% vs -30.32% in Sep 2024
Growth in half year ended Sep 2025 is 5.51% vs 2.64% in Sep 2024
Nine Monthly Results Snapshot (Consolidated) - Dec'25
YoY Growth in nine months ended Dec 2025 is 5.55% vs -31.89% in Dec 2024
YoY Growth in nine months ended Dec 2025 is 7.04% vs 10.20% in Dec 2024
Annual Results Snapshot (Consolidated) - Mar'26
YoY Growth in year ended Mar 2026 is 4.57% vs -26.35% in Mar 2025
YoY Growth in year ended Mar 2026 is 3.06% vs 10.76% in Mar 2025
About Sree Rayalaseema Hi-Strength Hypo Ltd

Company Coordinates


