
Compare Sri Havisha with Similar Stocks
Dashboard
With a Operating Losses, the company has a Weak Long Term Fundamental Strength
- Low ability to service debt as the company has a high Debt to EBITDA ratio of 48.63 times
- The company has been able to generate a Return on Equity (avg) of 1.59% signifying low profitability per unit of shareholders funds
Flat results in Mar 26
Risky - Negative Operating Profits
Below par performance in long term as well as near term
Stock DNA
Hotels & Resorts
INR 19 Cr (Micro Cap)
NA (Loss Making)
23
0.00%
2.32
-24.54%
0.96
Total Returns (Price + Dividend) 
Sri Havisha for the last several years.
Risk Adjusted Returns v/s
Returns Beta

News

Sri Havisha Hospitality & Infrastructure Ltd Locks at Lower Circuit With 3.45% Loss — Sellers Queue, No Buyers in Sight
At Rs 1.31, sellers were still queuing — but there were no buyers willing to take the other side. Sri Havisha Hospitality & Infrastructure Ltd locked at its lower circuit of 3.45% on 11 Jun 2026, with unfilled sell orders and a frozen price.
Read full news article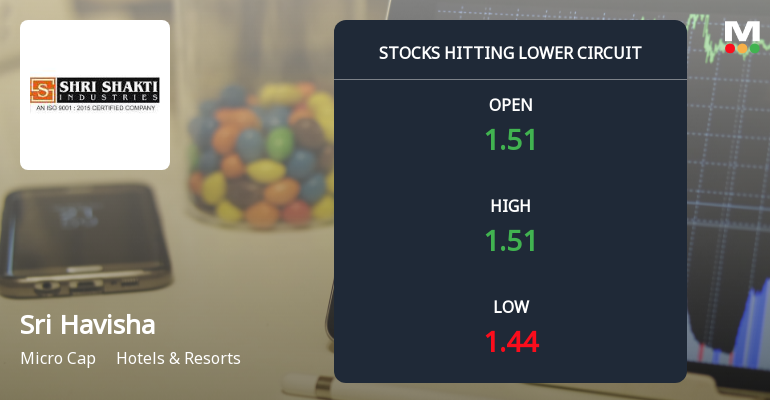
Sri Havisha Hospitality & Infrastructure Ltd Locks at Lower Circuit With 10.0% Loss — Sellers Queue, No Buyers in Sight
At Rs 1.33, sellers were still queuing — but there were no buyers willing to take the other side. Sri Havisha Hospitality & Infrastructure Ltd locked at its lower circuit of 10.0% on 10 Jun 2026, with unfilled sell orders and a frozen price that capped losses for the day.
Read full news article
Sri Havisha Hospitality & Infrastructure Ltd Locks at Lower Circuit With 4.64% Loss — Sellers Queue, No Buyers in Sight
At Rs 1.44, sellers were still queuing — but there were no buyers willing to take the other side. Sri Havisha Hospitality & Infrastructure Ltd locked at its lower circuit of 4.64% on 1 Jun 2026, with unfilled sell orders and a frozen price.
Read full news article Announcements
Sri Havisha Hospitality and Infrastructure Limited - Updates
03-Dec-2019 | Source : NSESri Havisha Hospitality and Infrastructure Limited has informed the Exchange regarding 'Intimation of death of Shri Abbury Panduranga Vitthal, Independent Director of the Company '.
Sri Havisha Hospitality and Infrastructure Limited - Updates
22-Nov-2019 | Source : NSESri Havisha Hospitality and Infrastructure Limited has informed the Exchange regarding 'Submission of Half Yearly Disclosure on Related Party Transactions Regulations 23 (9) of SEBI (Listing Obligations and Disclosure Requirements) Regulations, 2015.'.
Sri Havisha Hospitality and Infrastructure Limited - Updates
05-Nov-2019 | Source : NSESri Havisha Hospitality and Infrastructure Limited has informed the Exchange regarding 'DISCLOSURE UNDER SEBI TAKEOVER REGULATIONS '.
Corporate Actions

No Upcoming Board Meetings

No Dividend history available

No Splits history available

No Bonus history available

No Rights history available
Quality key factors
Valuation key factors
Technicals key factors
 Technical Indicator Scale: Bearish, Mildly Bearish, Sideways, Mildly Bullish, Bullish Turned
 Shareholding Snapshot : Mar 2026
Shareholding Compare (%holding)
Non Institution
None
Held by 0 Schemes
Held by 0 FIIs
Venkat Manohar Dontamsetti (14.77%)
None
36.89%
Quarterly Results Snapshot (Standalone) - Mar'26 - YoY

YoY Growth in quarter ended Mar 2026 is -3.51% vs 2.09% in Mar 2025

YoY Growth in quarter ended Mar 2026 is 44.21% vs 20.50% in Mar 2025
Half Yearly Results Snapshot (Standalone) - Sep'25
Growth in half year ended Sep 2025 is -17.11% vs -0.14% in Sep 2024
Growth in half year ended Sep 2025 is -105.62% vs -25.00% in Sep 2024
Nine Monthly Results Snapshot (Standalone) - Dec'25
YoY Growth in nine months ended Dec 2025 is -8.51% vs 0.90% in Dec 2024
YoY Growth in nine months ended Dec 2025 is -67.51% vs -35.43% in Dec 2024
Annual Results Snapshot (Standalone) - Mar'26
YoY Growth in year ended Mar 2026 is -7.34% vs 1.25% in Mar 2025
YoY Growth in year ended Mar 2026 is -18.03% vs -2.89% in Mar 2025
About Sri Havisha Hospitality & Infrastructure Ltd

Company Coordinates


