
Compare Sri KPR Inds. with Similar Stocks
Dashboard
With a Operating Losses, the company has a Weak Long Term Fundamental Strength
- Poor long term growth as Net Sales has grown by an annual rate of 8.65% over the last 5 years
- Company's ability to service its debt is weak with a poor EBIT to Interest (avg) ratio of 1.49
Flat results in Mar 26
With ROE of 4.7, it has a Expensive valuation with a 0.3 Price to Book Value
Below par performance in long term as well as near term
Stock DNA
Plastic Products - Industrial
INR 42 Cr (Micro Cap)
7.00
35
0.00%
-0.38
4.72%
0.33
Total Returns (Price + Dividend) 
Latest dividend: 1.0095238095238095 per share ex-dividend date: Sep-15-2021
Risk Adjusted Returns v/s
Returns Beta

News
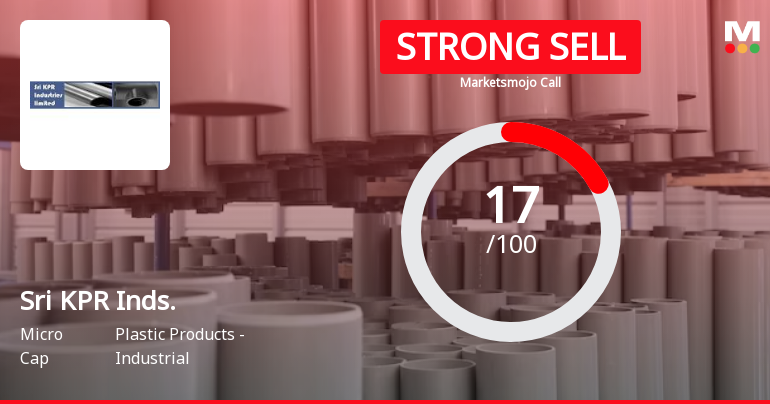
Sri KPR Industries Ltd is Rated Strong Sell
Sri KPR Industries Ltd is rated Strong Sell by MarketsMOJO. This rating was last updated on 29 June 2026, reflecting a significant reassessment of the stock’s outlook. However, all fundamentals, returns, and financial metrics discussed here are current as of 16 July 2026, providing investors with the latest comprehensive view of the company’s position.
Read full news article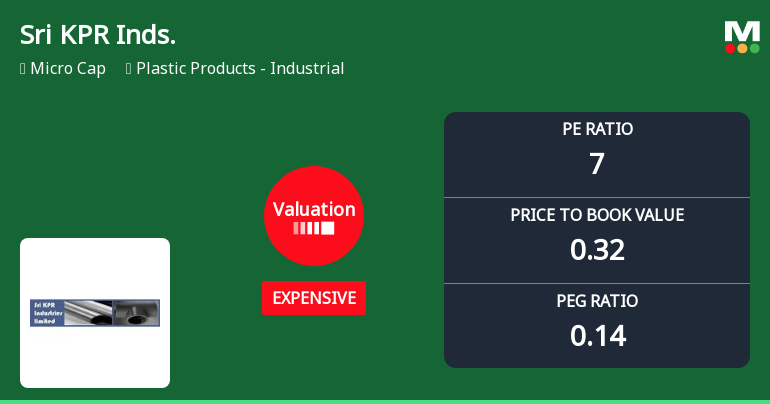
Sri KPR Industries Ltd Valuation Shifts Signal Price Attractiveness Concerns
Sri KPR Industries Ltd, a micro-cap player in the Plastic Products - Industrial sector, has seen its valuation parameters shift notably, prompting a downgrade in its investment grade to Strong Sell. Despite a modest day gain of 3.07%, the company’s price-to-earnings (P/E) and price-to-book value (P/BV) ratios now suggest an expensive valuation relative to its historical and peer averages, raising questions about its price attractiveness for investors.
Read full news article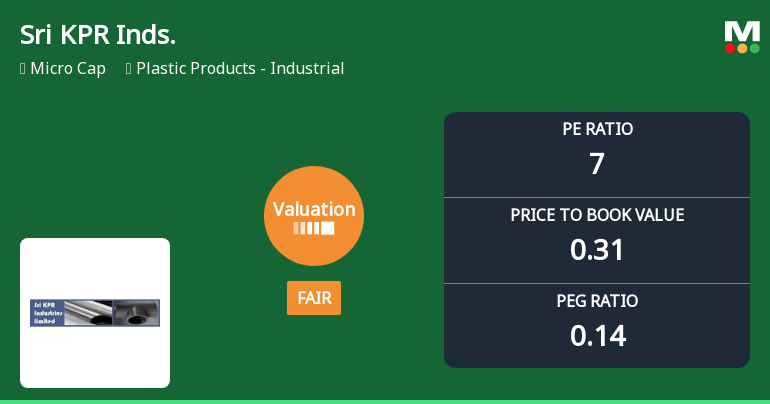
Sri KPR Industries Ltd Valuation Shifts to Fair Amidst Challenging Market Returns
Sri KPR Industries Ltd, a micro-cap player in the Plastic Products - Industrial sector, has recently undergone a significant valuation re-rating, shifting from an expensive to a fair valuation grade. This article examines the key valuation parameters, compares them with industry peers and historical benchmarks, and analyses the implications for investors amid a challenging market backdrop.
Read full news article Announcements
Compliances-Certificate under Reg. 74 (5) of SEBI (DP) Regulations 2018
08-Jul-2026 | Source : BSECertificates received from KFin Technologies Limited under regulation 74(5) of SEBI (DP) Regulations2018
Closure of Trading Window
27-Jun-2026 | Source : BSEClosure of trading window for dealing in secuityies of the Company for the quarter ended 30th June 2026
Compliances-Reg.24(A)-Annual Secretarial Compliance
27-May-2026 | Source : BSEAnnual Secreatrial Compliance Report for the year ended 31.03.2026
Corporate Actions

No Upcoming Board Meetings

Sri KPR Industries Ltd has declared 10% dividend, ex-date: 15 Sep 21

No Splits history available

No Bonus history available

No Rights history available
Quality key factors
Valuation key factors
Technicals key factors
 Technical Indicator Scale: Bearish, Mildly Bearish, Sideways, Mildly Bullish, Bullish Turned
 Shareholding Snapshot : Jun 2026
Shareholding Compare (%holding)
Promoters
None
Held by 0 Schemes
Held by 0 FIIs
Kishan Reddy Nalla (9.72%)
Smt Gaddam Sushila Raja Reddy Foundation (3.44%)
29.28%
Quarterly Results Snapshot (Consolidated) - Mar'26 - YoY

YoY Growth in quarter ended Mar 2026 is -32.49% vs 39.65% in Mar 2025

YoY Growth in quarter ended Mar 2026 is -30.95% vs -83.20% in Mar 2025
Half Yearly Results Snapshot (Consolidated) - Sep'25
Growth in half year ended Sep 2025 is 13.39% vs -16.63% in Sep 2024
Growth in half year ended Sep 2025 is -1.67% vs 32.59% in Sep 2024
Nine Monthly Results Snapshot (Consolidated) - Dec'25
YoY Growth in nine months ended Dec 2025 is 25.58% vs -21.69% in Dec 2024
YoY Growth in nine months ended Dec 2025 is 45.58% vs -22.12% in Dec 2024
Annual Results Snapshot (Consolidated) - Mar'26
YoY Growth in year ended Mar 2026 is 10.44% vs -11.56% in Mar 2025
YoY Growth in year ended Mar 2026 is 38.61% vs -41.50% in Mar 2025
About Sri KPR Industries Ltd

Company Coordinates


