
Compare Sri Ramakr. Mill with Similar Stocks
Dashboard
High Debt company with Weak Long Term Fundamental Strength
- High Debt Company with a Debt to Equity ratio (avg) of 2.00 times
With a growth in Net Sales of 265.06%, the company declared Outstanding results in Mar 26
With ROCE of 25.9, it has a Very Attractive valuation with a 0.9 Enterprise value to Capital Employed
Majority shareholders : Promoters
Market Beating performance in long term as well as near term
Stock DNA
Garments & Apparels
INR 39 Cr (Micro Cap)
2.00
23
0.00%
0.72
39.90%
0.82
Total Returns (Price + Dividend) 
Sri Ramakr. Mill for the last several years.
Risk Adjusted Returns v/s
Returns Beta

News

Sri Ramakrishna Mills Upgraded to Hold on Strong Financial and Valuation Metrics
Sri Ramakrishna Mills (Coimbatore) Ltd has seen its investment rating upgraded from Sell to Hold, reflecting a marked improvement across key parameters including financial performance, valuation, and technical indicators. The company’s recent quarterly results and valuation metrics have driven this positive reassessment, signalling renewed investor confidence in this micro-cap textile player.
Read full news article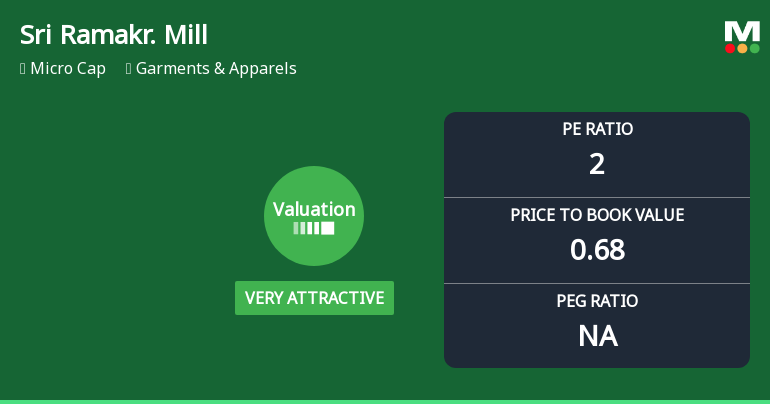
Sri Ramakrishna Mills: Valuation Shifts Signal Renewed Price Attractiveness
Sri Ramakrishna Mills (Coimbatore) Ltd has witnessed a significant transformation in its valuation metrics, moving from a risky to a very attractive investment proposition. This shift, underscored by a remarkably low price-to-earnings ratio and price-to-book value, has caught the attention of investors seeking value in the Garments & Apparels sector amid a challenging market backdrop.
Read full news article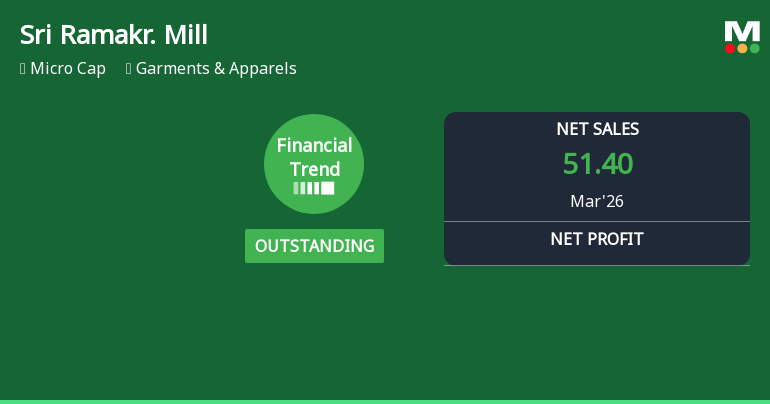
Sri Ramakrishna Mills Reports Outstanding Quarterly Performance Amid Financial Turnaround
Sri Ramakrishna Mills (Coimbatore) Ltd has delivered an exceptional quarterly performance for the period ended March 2026, marking a significant turnaround in its financial trend. The company’s latest results reveal record-breaking revenue and profit metrics, signalling a robust recovery in the garments and apparels sector despite broader market challenges.
Read full news article Announcements
Announcement under Regulation 30 (LODR)-Newspaper Publication
01-Jun-2026 | Source : BSENewspaper cutting reg publication of Financial Results enclosed
Board Meeting Outcome for AUDITED RESULTS FOR THE FOURTH QUARTER AND YEAR ENDED 31.03.2026
29-May-2026 | Source : BSEAUDITED RESULTS FOR THE FOURTH QUARTER AND YEAR ENDED 31.03.2026 ALONGWITH DECLARATION OF UNMODIFIED OPINION ATTACHED
AUDITED FINANCIAL RESULTS FOR THE FOURTH QUARTER AND YEAR ENDED 31.03.2026
29-May-2026 | Source : BSEAUDITED FINANCIAL RESULTS FOR THE FOURTH QUARTER AND YEAR ENDED 31.03.2026 ATTACHED
Corporate Actions

No Upcoming Board Meetings

No Dividend history available

No Splits history available

No Bonus history available

No Rights history available
Quality key factors
Valuation key factors
Technicals key factors
 Technical Indicator Scale: Bearish, Mildly Bearish, Sideways, Mildly Bullish, Bullish Turned
 Shareholding Snapshot : Mar 2026
Shareholding Compare (%holding)
Promoters
None
Held by 0 Schemes
Held by 0 FIIs
Lakshminarayanaswamy.d (22.24%)
Raju Ajit Bhandari (4.73%)
32.18%
Quarterly Results Snapshot (Standalone) - Mar'26 - QoQ

QoQ Growth in quarter ended Mar 2026 is 265.06% vs -10.83% in Dec 2025
QoQ Growth in quarter ended Mar 2026 is 2,870.64% vs -17.20% in Dec 2025
Half Yearly Results Snapshot (Standalone) - Sep'25

Growth in half year ended Sep 2025 is -14.34% vs 37.35% in Sep 2024
Growth in half year ended Sep 2025 is -138.82% vs 4.68% in Sep 2024
Nine Monthly Results Snapshot (Standalone) - Dec'25
YoY Growth in nine months ended Dec 2025 is -37.86% vs 99.28% in Dec 2024
YoY Growth in nine months ended Dec 2025 is -169.72% vs -14.19% in Dec 2024
Annual Results Snapshot (Standalone) - Mar'26
YoY Growth in year ended Mar 2026 is 12.68% vs 46.84% in Mar 2025
YoY Growth in year ended Mar 2026 is 652.05% vs -43.67% in Mar 2025
About Sri Ramakrishna Mills (Coimbatore) Ltd

Company Coordinates


