
Compare SSPDL Ltd with Similar Stocks
Dashboard
High Debt company with Weak Long Term Fundamental Strength
- High Debt Company with a Debt to Equity ratio (avg) of 10.88 times
- The company has been able to generate a Return on Capital Employed (avg) of 6.77% signifying low profitability per unit of total capital (equity and debt)
Positive results in Mar 26
With ROCE of 32.1, it has a Very Attractive valuation with a 1.4 Enterprise value to Capital Employed
Majority shareholders : Promoters
Market Beating Performance
Total Returns (Price + Dividend) 
Latest dividend: 2 per share ex-dividend date: Jul-19-2007
Risk Adjusted Returns v/s
Returns Beta

News

SSPDL Ltd Upgraded to Hold as Financial and Technical Metrics Improve
SSPDL Ltd, a micro-cap player in the realty sector, has seen its investment rating upgraded from Sell to Hold as of 3 June 2026, reflecting notable improvements across financial performance, valuation metrics, and technical indicators. This upgrade follows a comprehensive reassessment of the company’s quality, financial trends, valuation attractiveness, and technical outlook, signalling a cautious but positive stance for investors.
Read full news article
SSPDL Ltd Upgraded to Sell on Improved Financials and Technicals
SSPDL Ltd, a micro-cap player in the realty sector, has seen its investment rating upgraded from Strong Sell to Sell as of 2 June 2026, reflecting notable improvements in its financial and technical parameters. Despite lingering valuation challenges and high debt levels, the company’s recent quarterly performance and positive technical signals have prompted a reassessment of its outlook.
Read full news article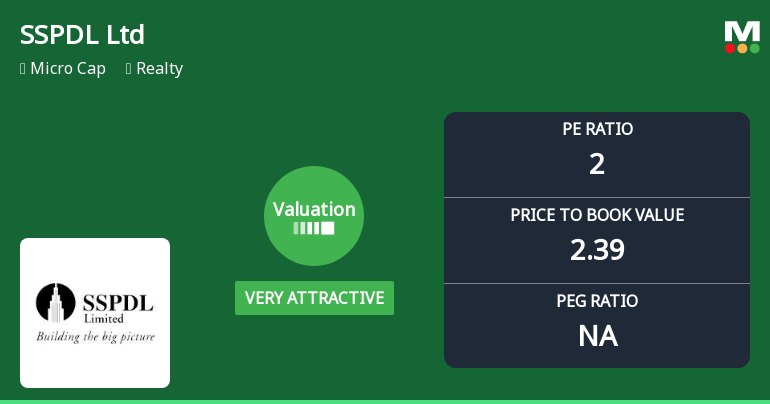
SSPDL Ltd Valuation Shifts Signal Changing Price Attractiveness in Realty Sector
SSPDL Ltd, a micro-cap player in the realty sector, has witnessed a notable shift in its valuation parameters, reflecting a changing market perception. The company’s price-to-earnings (P/E) and price-to-book value (P/BV) ratios have moved from risky territory to a status of “does not qualify,” signalling a potential reappraisal of its price attractiveness relative to peers and historical benchmarks.
Read full news article Announcements
Announcement under Regulation 30 (LODR)-Newspaper Publication
01-Jun-2026 | Source : BSEplease find enclosed herewith the financial results published on 31.05.2026 in English and Telugu newspapers daily i.e. Financial express and Navatelangana.
Results For The Quarter And Financial Year Ended 31.03.2026
30-May-2026 | Source : BSEplease find enclosed herewith the annual audited financial results of the company for the quarter and financial and year ended 31.03.2026
Board Meeting Intimation for Compliance Of Regulation 29 Of The SEBI (Listing Obligations And Disclosure Requirements) Regulations 2015 - Intimation Of Date Of Board Meeting
22-May-2026 | Source : BSESSPDL Ltd-has informed BSE that the meeting of the Board of Directors of the Company is scheduled on 30/05/2026 inter alia to consider and approve This is to inform you that a meeting of the Board of Directors of the Company will be held on Saturday the 30th day of May 2026 at the Registered Office of the Company inter alia to consider and approve the Standalone and Consolidated audited financial results/financial statements of the Company for the fourth quarter/financial year ended 31st March 2026.
Corporate Actions

No Upcoming Board Meetings

SSPDL Ltd has declared 20% dividend, ex-date: 19 Jul 07

No Splits history available

No Bonus history available

SSPDL Ltd has announced 2:1 rights issue, ex-date: 24 Apr 07
Quality key factors
Valuation key factors
Technicals key factors
 Technical Indicator Scale: Bearish, Mildly Bearish, Sideways, Mildly Bullish, Bullish Turned
 Shareholding Snapshot : Mar 2026
Shareholding Compare (%holding)
Promoters
None
Held by 0 Schemes
Held by 0 FIIs
Srikrishna Devaraya Hatcheries Pvt Ltd (18.58%)
Gautam Prakash (2.74%)
37.32%
Quarterly Results Snapshot (Consolidated) - Mar'26 - YoY

YoY Growth in quarter ended Mar 2026 is 1,507.87% vs 17.11% in Mar 2025
YoY Growth in quarter ended Mar 2026 is 377.12% vs 160.71% in Mar 2025
Half Yearly Results Snapshot (Consolidated) - Sep'25

Growth in half year ended Sep 2025 is -100.00% vs -88.41% in Sep 2024
Growth in half year ended Sep 2025 is -69.52% vs 38.49% in Sep 2024
Nine Monthly Results Snapshot (Consolidated) - Dec'25
YoY Growth in nine months ended Dec 2025 is 561.61% vs -88.74% in Dec 2024
YoY Growth in nine months ended Dec 2025 is 265.99% vs -951.52% in Dec 2024
Annual Results Snapshot (Consolidated) - Mar'26
YoY Growth in year ended Mar 2026 is 845.48% vs -84.67% in Mar 2025
YoY Growth in year ended Mar 2026 is 770.62% vs 31.69% in Mar 2025
About SSPDL Ltd

Company Coordinates


