
Compare Stagwell, Inc. with Similar Stocks
Dashboard
High Debt Company with a Debt to Equity ratio (avg) at times
- High Debt Company with a Debt to Equity ratio (avg) at times
High Debt company with Weak Long Term Fundamental Strength
Positive results in Jun 25
With ROCE of 9.05%, it has a attractive valuation with a 1.50 Enterprise value to Capital Employed
Consistent Underperformance against the benchmark over the last 3 years
Total Returns (Price + Dividend) 
Stagwell, Inc. for the last several years.
Risk Adjusted Returns v/s
News
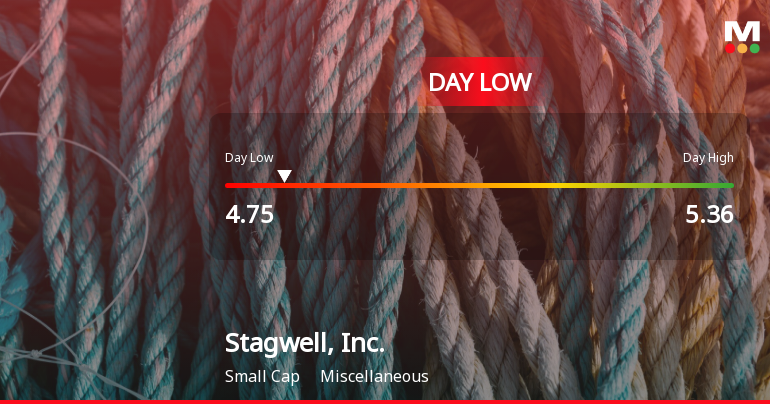
Stagwell, Inc. Hits Day Low at $4.75 Amid Price Pressure
Stagwell, Inc. faced notable volatility on November 7, 2025, with a significant stock price decline. Over the past year, the company has underperformed compared to the S&P 500, and its financial metrics indicate reliance on debt financing and potential concerns regarding long-term stability amidst a challenging market environment.
Read full news article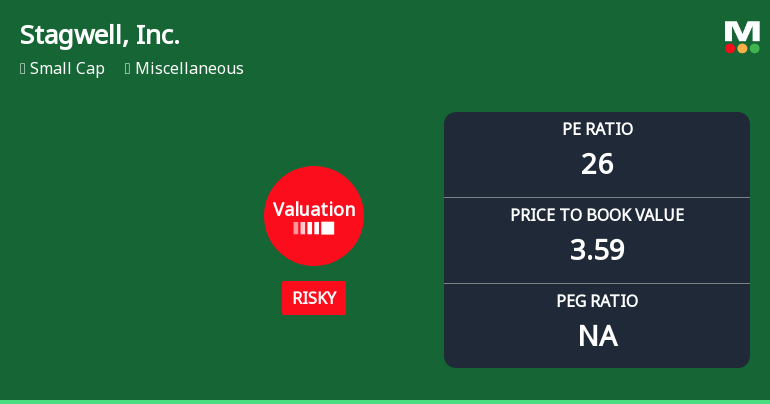
Stagwell, Inc. Experiences Revision in Its Stock Evaluation Amid Mixed Financial Metrics
Stagwell, Inc. has recently adjusted its valuation, with a P/E ratio of 26 and a price-to-book value of 3.59. Key financial metrics indicate operational efficiency, while its stock price has fluctuated between 4.03 and 8.18. The company faces competitive challenges compared to peers like CRA International and Viad Corp.
Read full news article Announcements

Corporate Actions
Quality key factors
Valuation key factors
Technicals key factors
 Technical Indicator Scale: Bearish, Mildly Bearish, Sideways, Mildly Bullish, Bullish Turned
 Shareholding Snapshot : Sep 2025
Shareholding Compare (%holding)
Domestic Funds
Held in 42 Schemes (13.91%)
Held by 71 Foreign Institutions (4.04%)
Quarterly Results Snapshot (Consolidated) - Sep'25 - YoY

YoY Growth in quarter ended Sep 2025 is 4.21% vs 15.68% in Sep 2024
YoY Growth in quarter ended Sep 2025 is 71.22% vs 348.39% in Sep 2024
Annual Results Snapshot (Consolidated) - Dec'24

YoY Growth in year ended Dec 2024 is 12.29% vs -6.44% in Dec 2023
YoY Growth in year ended Dec 2024 is -39.90% vs -16.80% in Dec 2023
About Stagwell, Inc.

Company Coordinates


