
Compare Stanley Black & Decker, Inc. with Similar Stocks
Total Returns (Price + Dividend) 
Stanley Black & Decker, Inc. for the last several years.
Risk Adjusted Returns v/s
News

Stanley Black & Decker Forms Death Cross, Signals Bearish Trend Ahead
Stanley Black & Decker, Inc. has recently encountered a Death Cross, indicating potential bearish market sentiment. The company has faced significant declines, with a 28.65% drop over the past year and a 61.63% decrease over five years, contrasting sharply with the S&P 500's performance. Technical indicators also suggest ongoing challenges.
Read full news article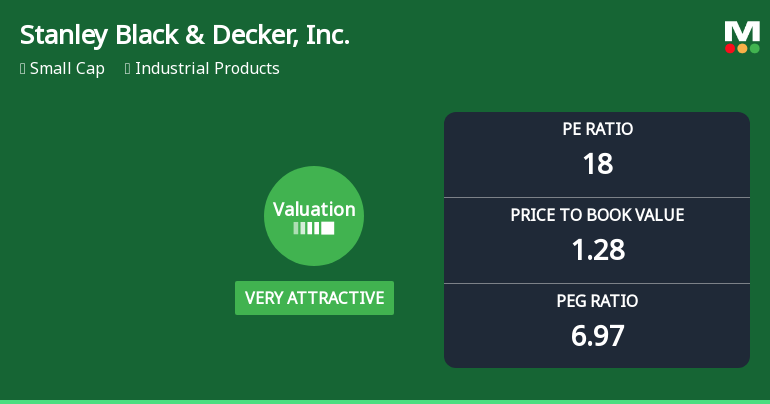
Stanley Black & Decker Experiences Valuation Adjustment Amidst Shifting Financial Metrics
Stanley Black & Decker, Inc. has recently adjusted its valuation metrics, featuring a P/E ratio of 18 and a price-to-book value of 1.28. Despite a year-to-date return of -15.66% and a 27.14% decline over the past year, the company maintains a dividend yield of 3.56%.
Read full news article Announcements

Corporate Actions
Quality key factors
Valuation key factors
Technicals key factors
 Technical Indicator Scale: Bearish, Mildly Bearish, Sideways, Mildly Bullish, Bullish Turned
 Shareholding Snapshot : Mar 2025
Shareholding Compare (%holding)
Domestic Funds
Held in 117 Schemes (52.2%)
Held by 318 Foreign Institutions (17.0%)
Quarterly Results Snapshot (Consolidated) - Jun'25 - QoQ

QoQ Growth in quarter ended Jun 2025 is 5.36% vs 0.65% in Mar 2025
QoQ Growth in quarter ended Jun 2025 is 12.72% vs -53.62% in Mar 2025
Annual Results Snapshot (Consolidated) - Dec'24
YoY Growth in year ended Dec 2024 is -2.63% vs -6.88% in Dec 2023
YoY Growth in year ended Dec 2024 is 201.63% vs -264.26% in Dec 2023
About Stanley Black & Decker, Inc.

Company Coordinates


